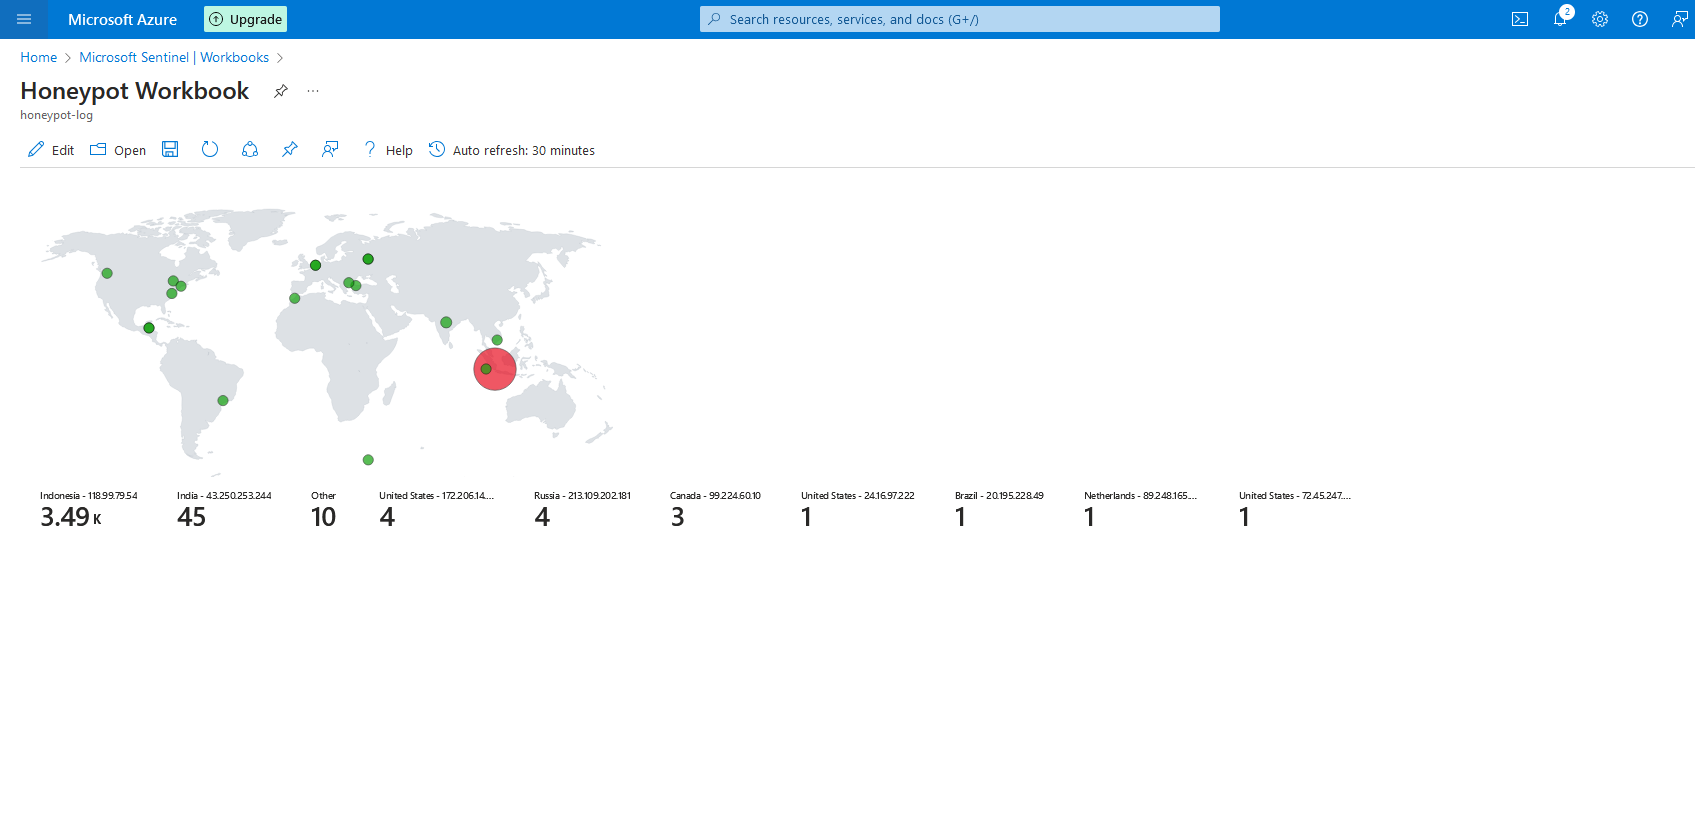
In this tutorial, I'm going to show you how to create your own SIEM lab using Azure! When you're done you'll have the ability to monitor a honeypot and visualize real-time security log data, uncluding GPS location data, thanks to some third party API integration. Lets get started!
Step 1 - Create free Azure Account and prepare host machine
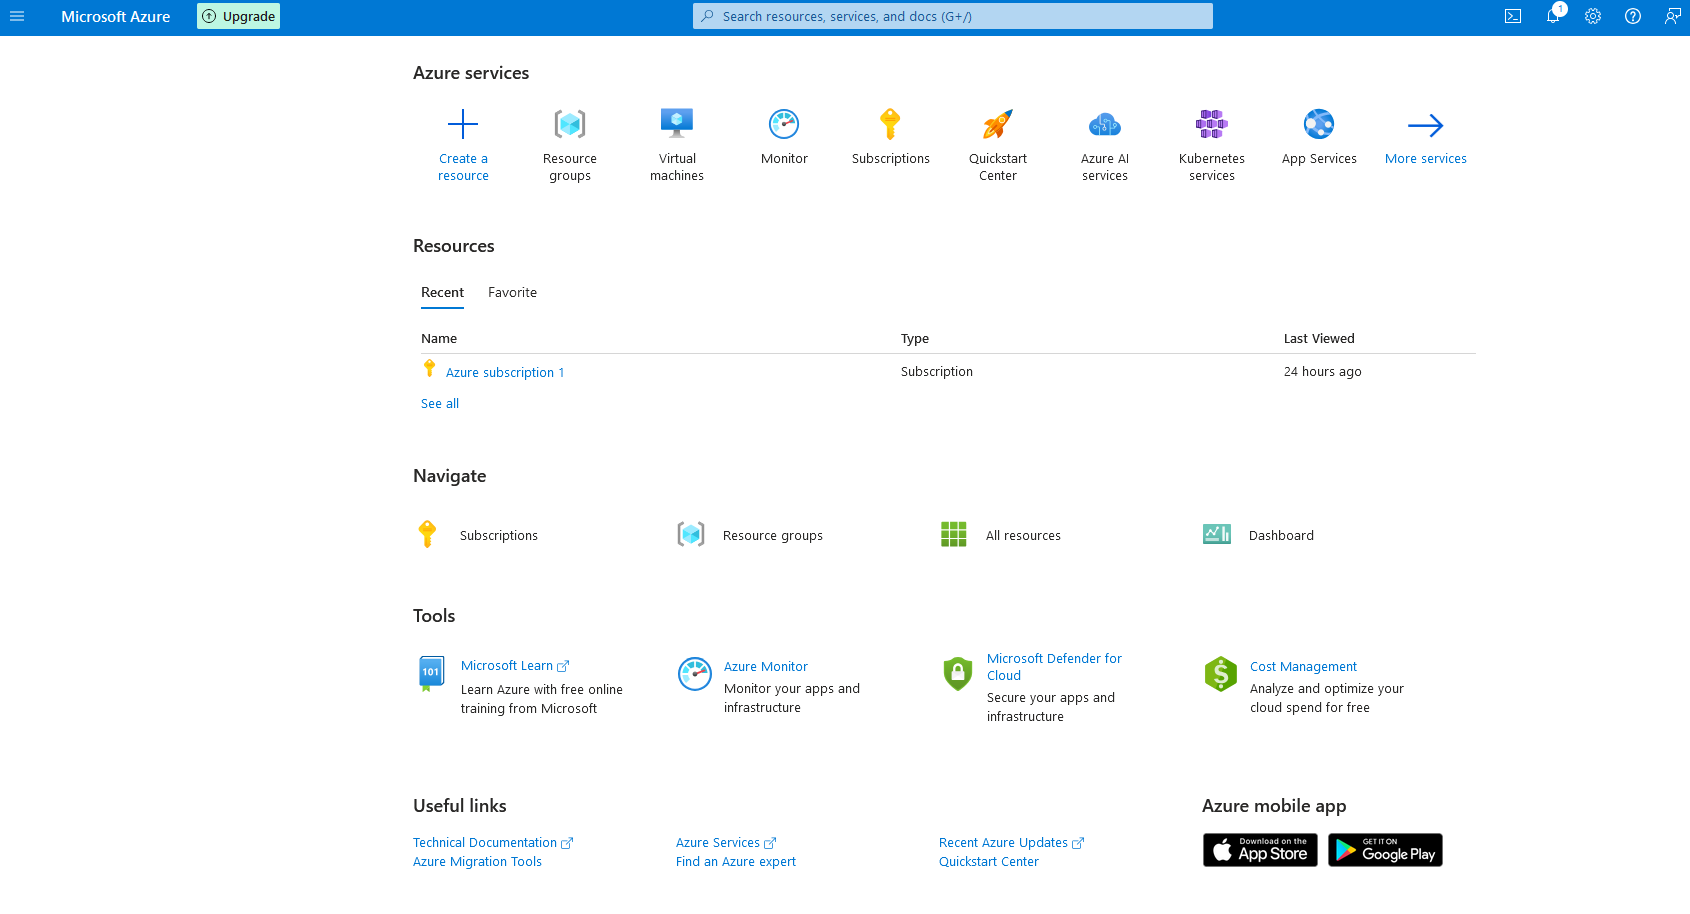
1a. Go to this url https://azure.microsoft.com/, and either log in with an existing microsoft account, or create a new one. Enter all of your information, including banking information (for verification/registrations purposes, no fees). Once your registration is completed, go to https://portal.azure.com, and log in with your account
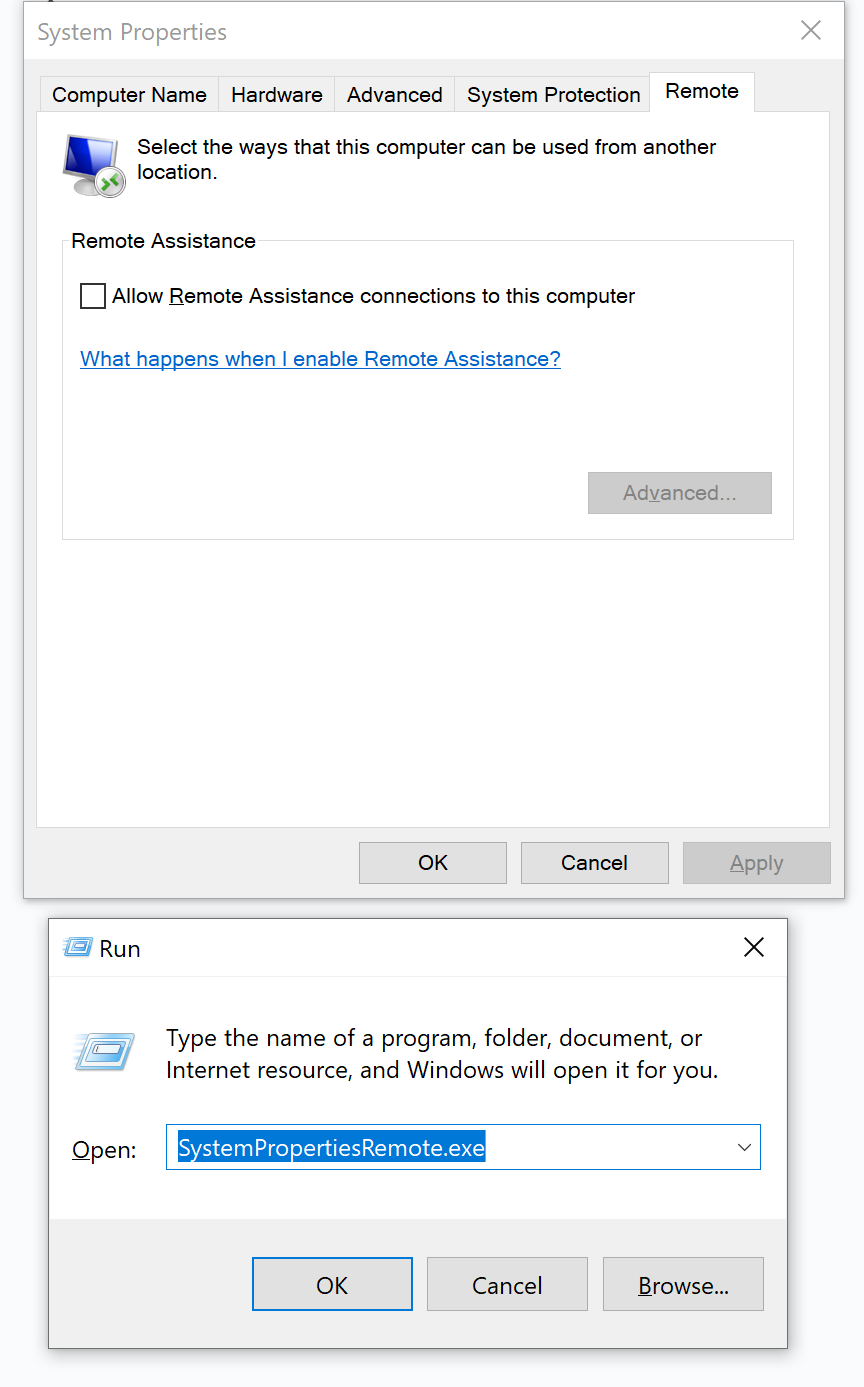
1b. Before we go further, we will disable any incoming Remote desktop traffic on our actual computer as an added precaution. Press the windows key and R on your keyboard at the same time, type in SystemPropertiesRemote.exe. From there, uncheck Allow remote connections to this computer, hit apply, then ok.
Step 2 - Create a Virtual Machine
2a. Before we create the VM(Virtual Machine), we need to create a resource group. Click on or search for the "Resource groups" Application
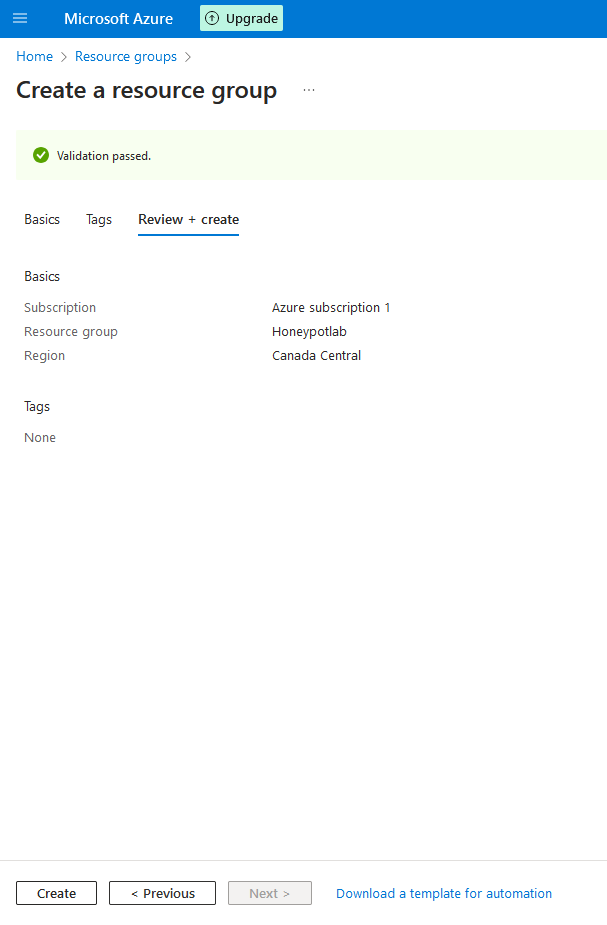
2b. Click on "+ Create" and call it whatever you like. For this lab, I'm going to call mine "Honeypotlab".
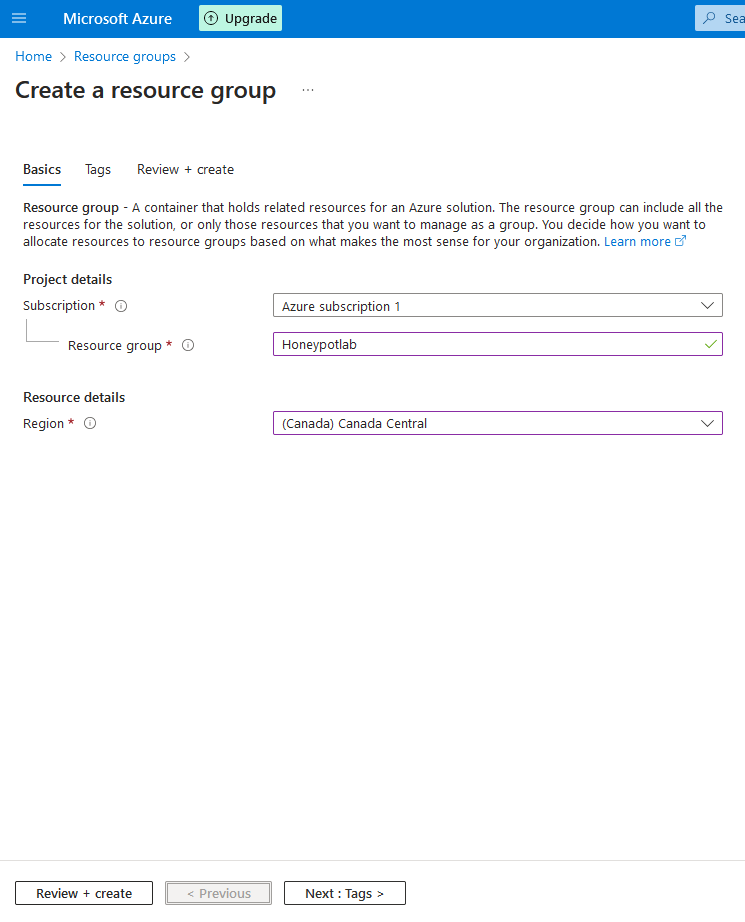
2c. Click on "Review and Create", then "Create"
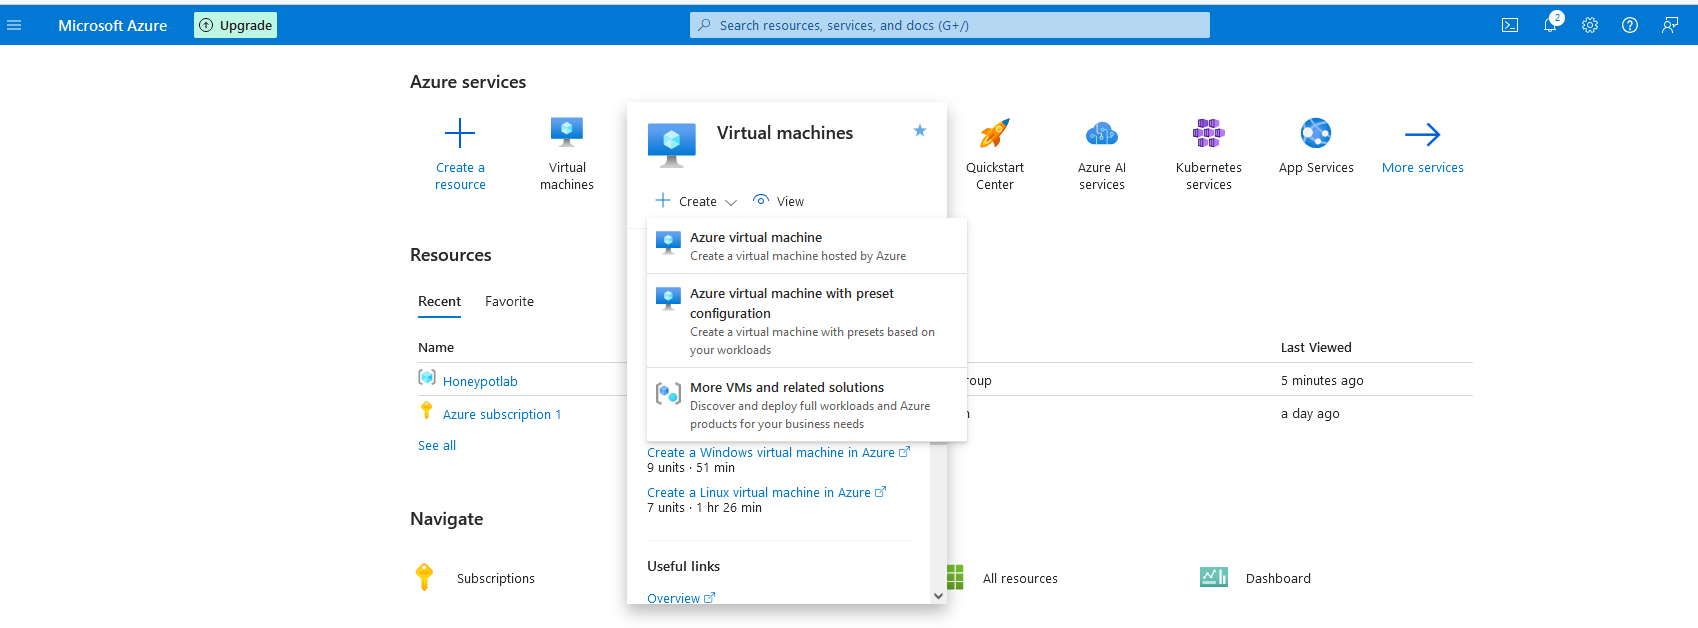
2d. Now we can create our machine. From the main screen, hover over virtual machines, then click create, then click "Azure Virtual Machine"

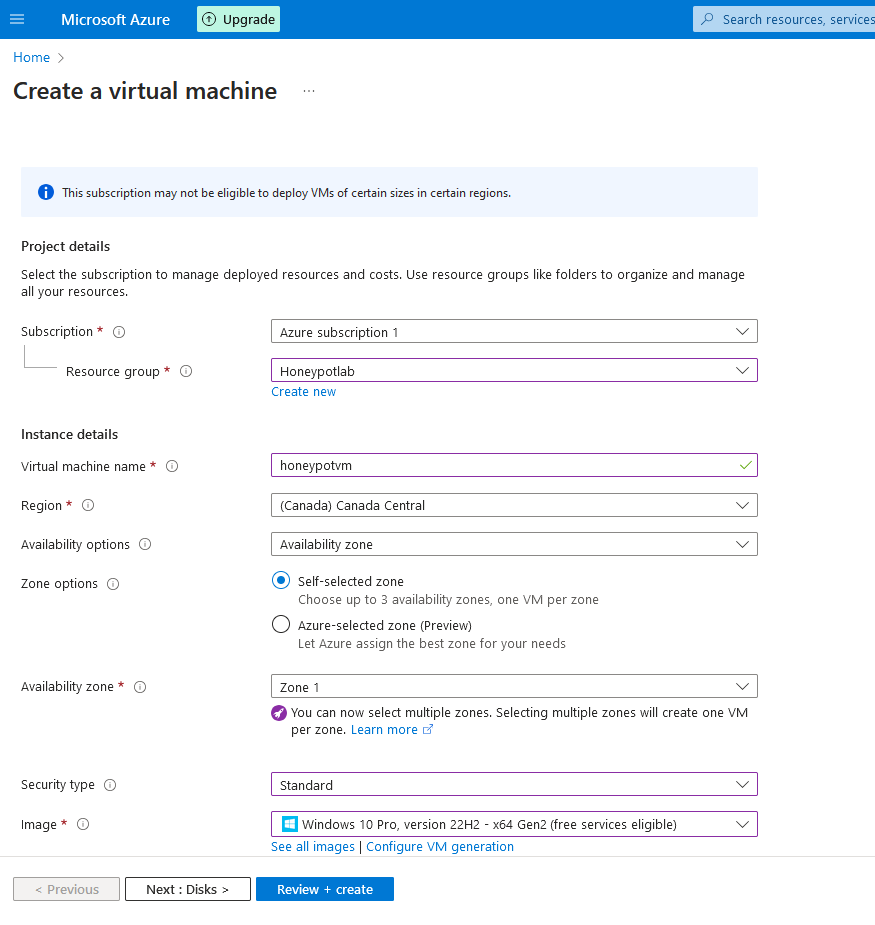
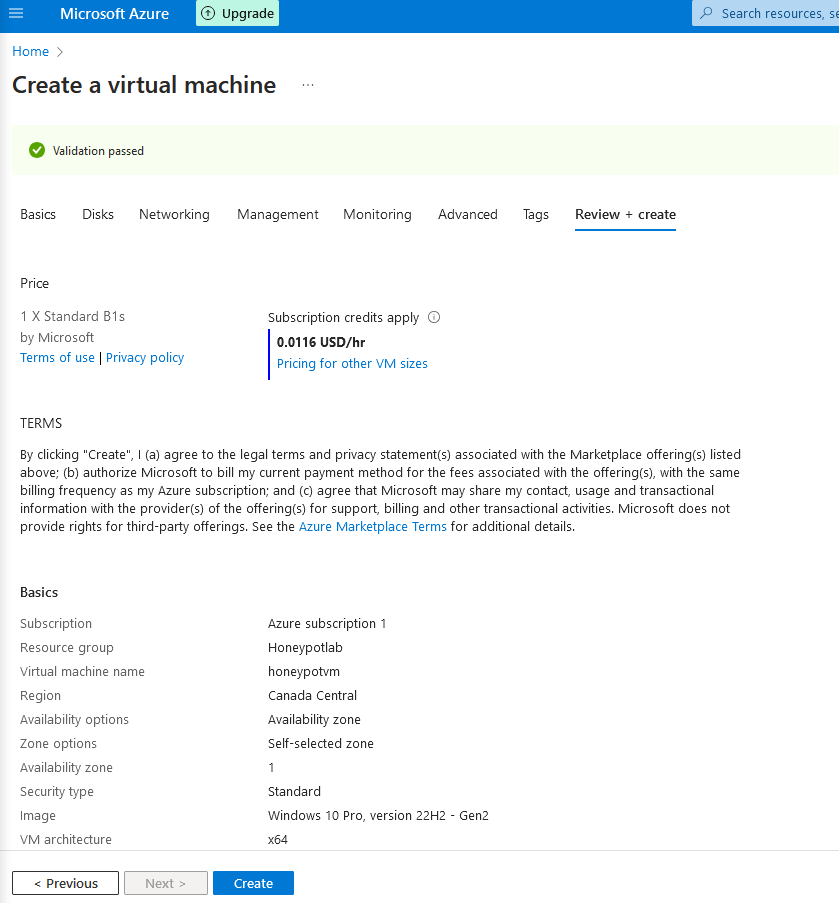
2e. Call the Machine what you want, I'll be calling mine "honeypotvm". Set the security type to "standard" and for the OS image, select either windows 10 or 11 Ill be using windows 10).
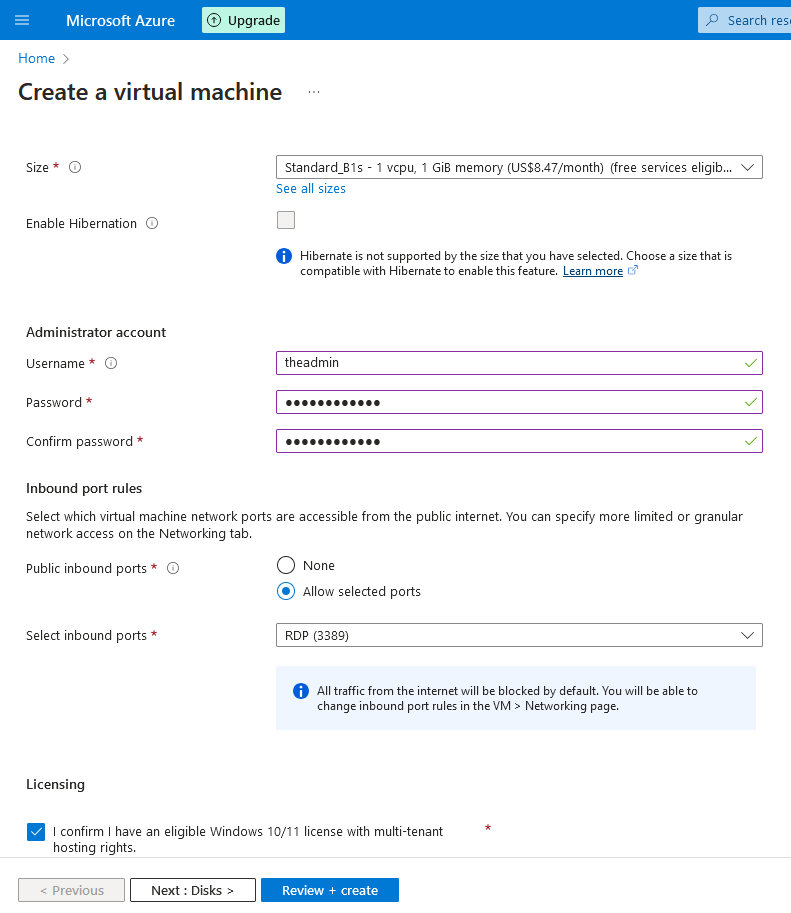
2f. Leave the size to whatever default option is there, then enter in a username and password for the virtual machine. Make sure to remember these credentials as they will be needed to access the machine later. Afterwards, click on the check box at the bottom, then click the "next" button twice
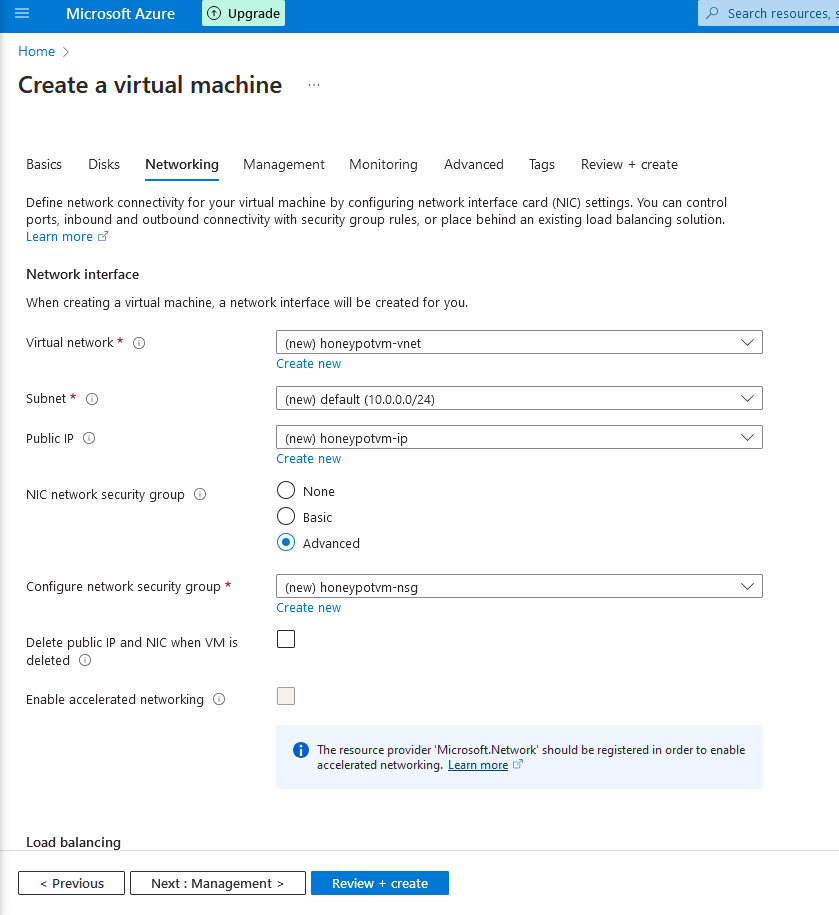
2g. Now we're going to configure the network security to make this VM vulnerable. In the NIC network security group setting , click on " advanced" , then click "create new"
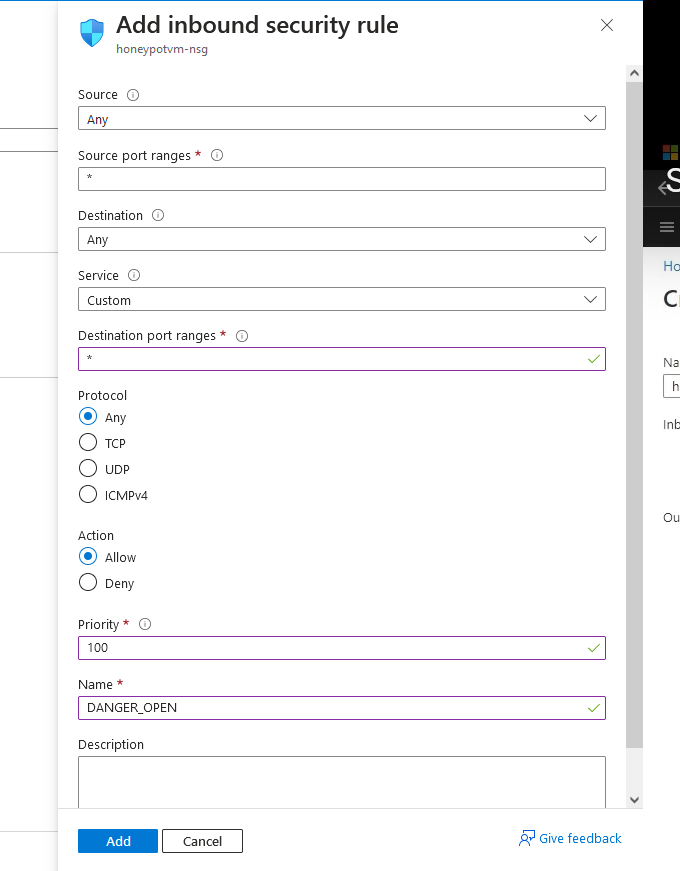
2h. Remove any existing default rules, then check "add new inbound rule"


2i. Configure the inbound rules exactly as you see in the screenshot. Leave action as "allow", and priority "100". You can use whatever name, I'll be calling it DANGER_OPEN". After all that is done, click "add"
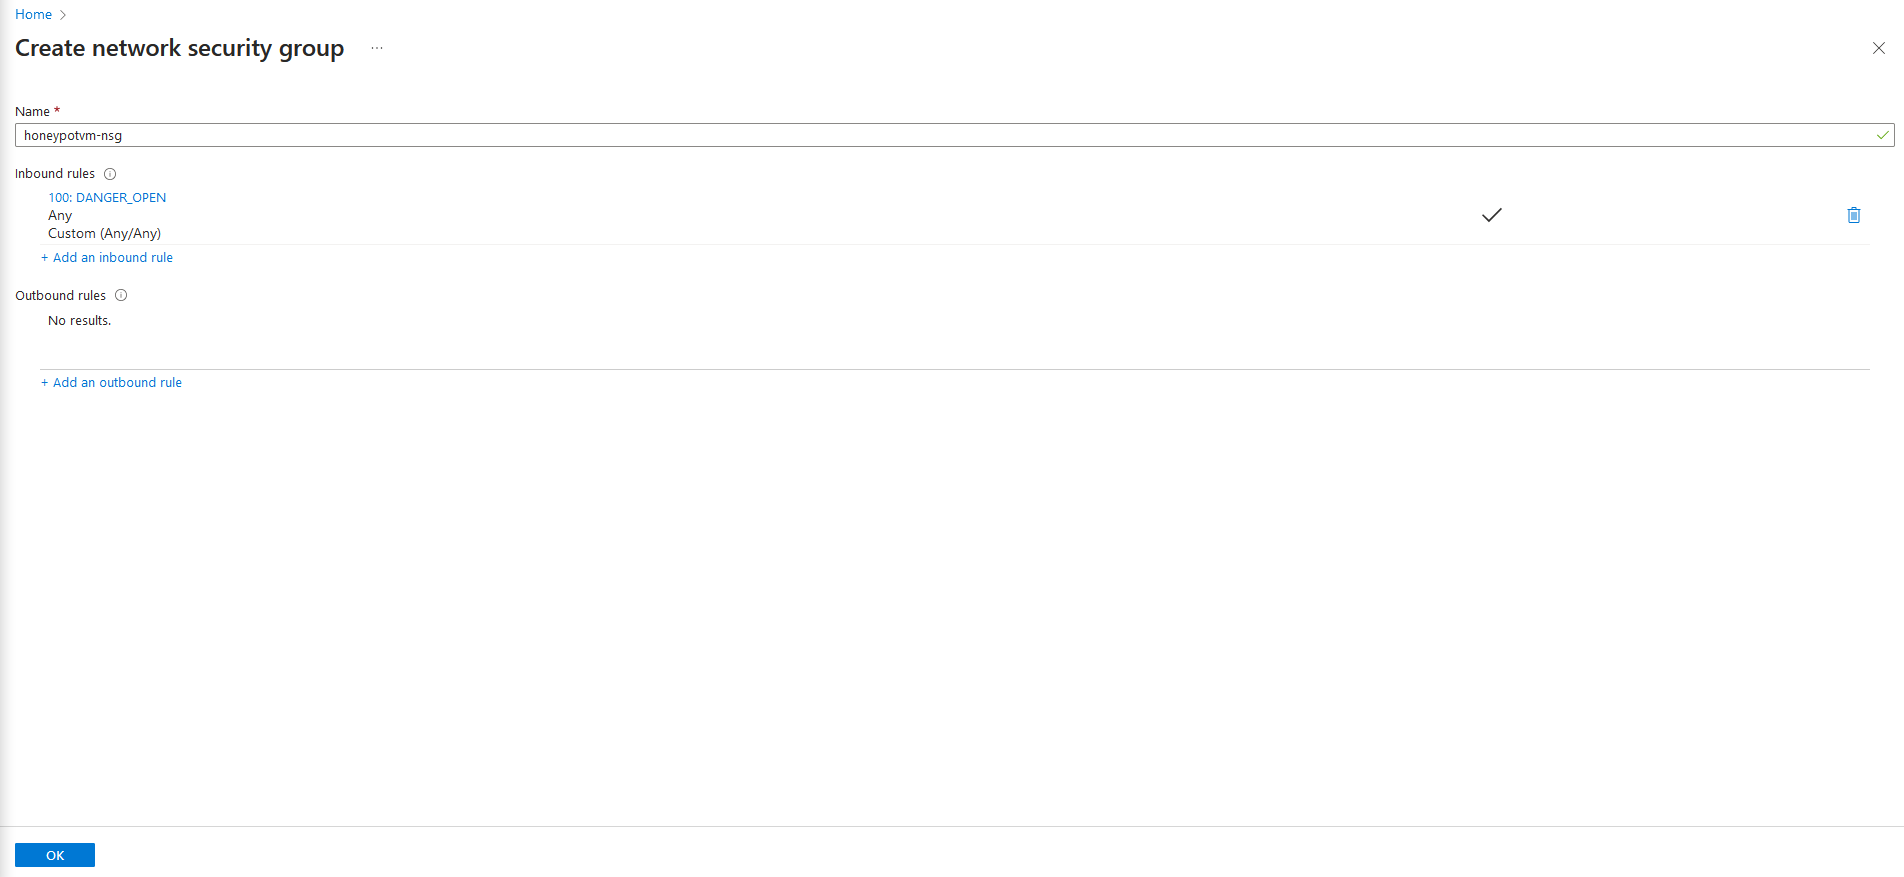
2j Afterwards, click done, then "review + create"
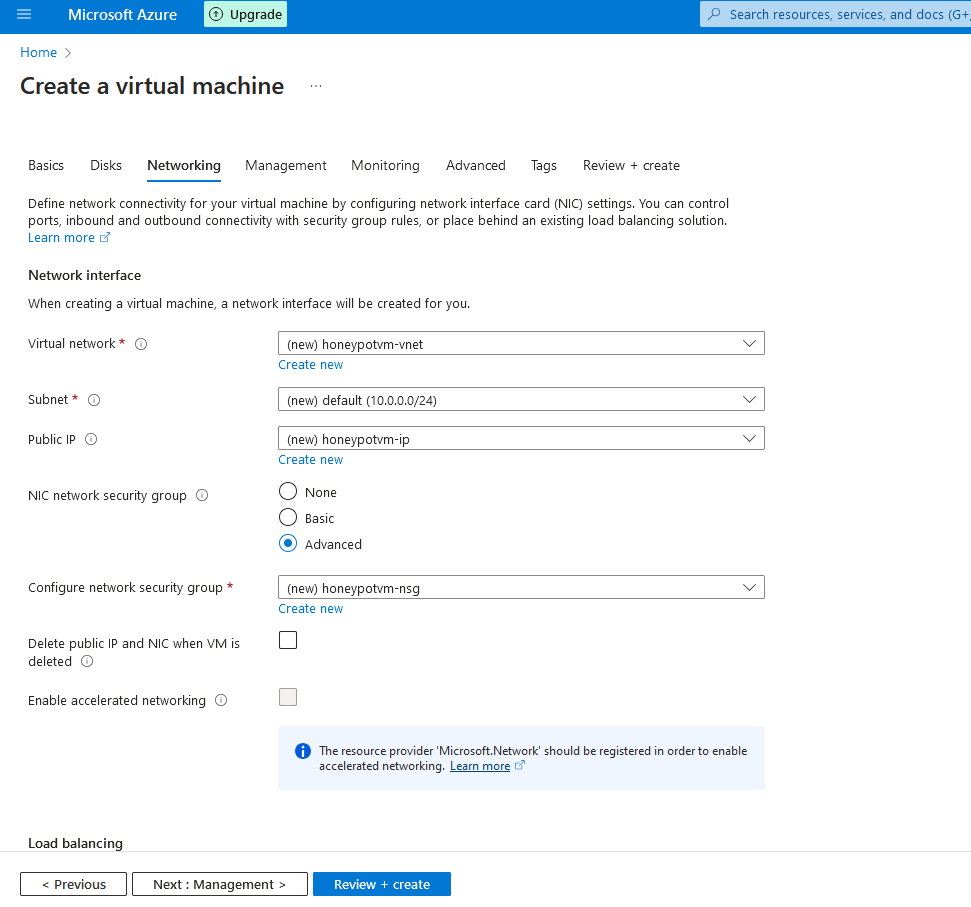
2k. After a few seconds, when you're able to, click on "Create" . The deployment will take some time. While we wait, we can multitask and progress to the next step.
Step 3 - Create a Log Repository
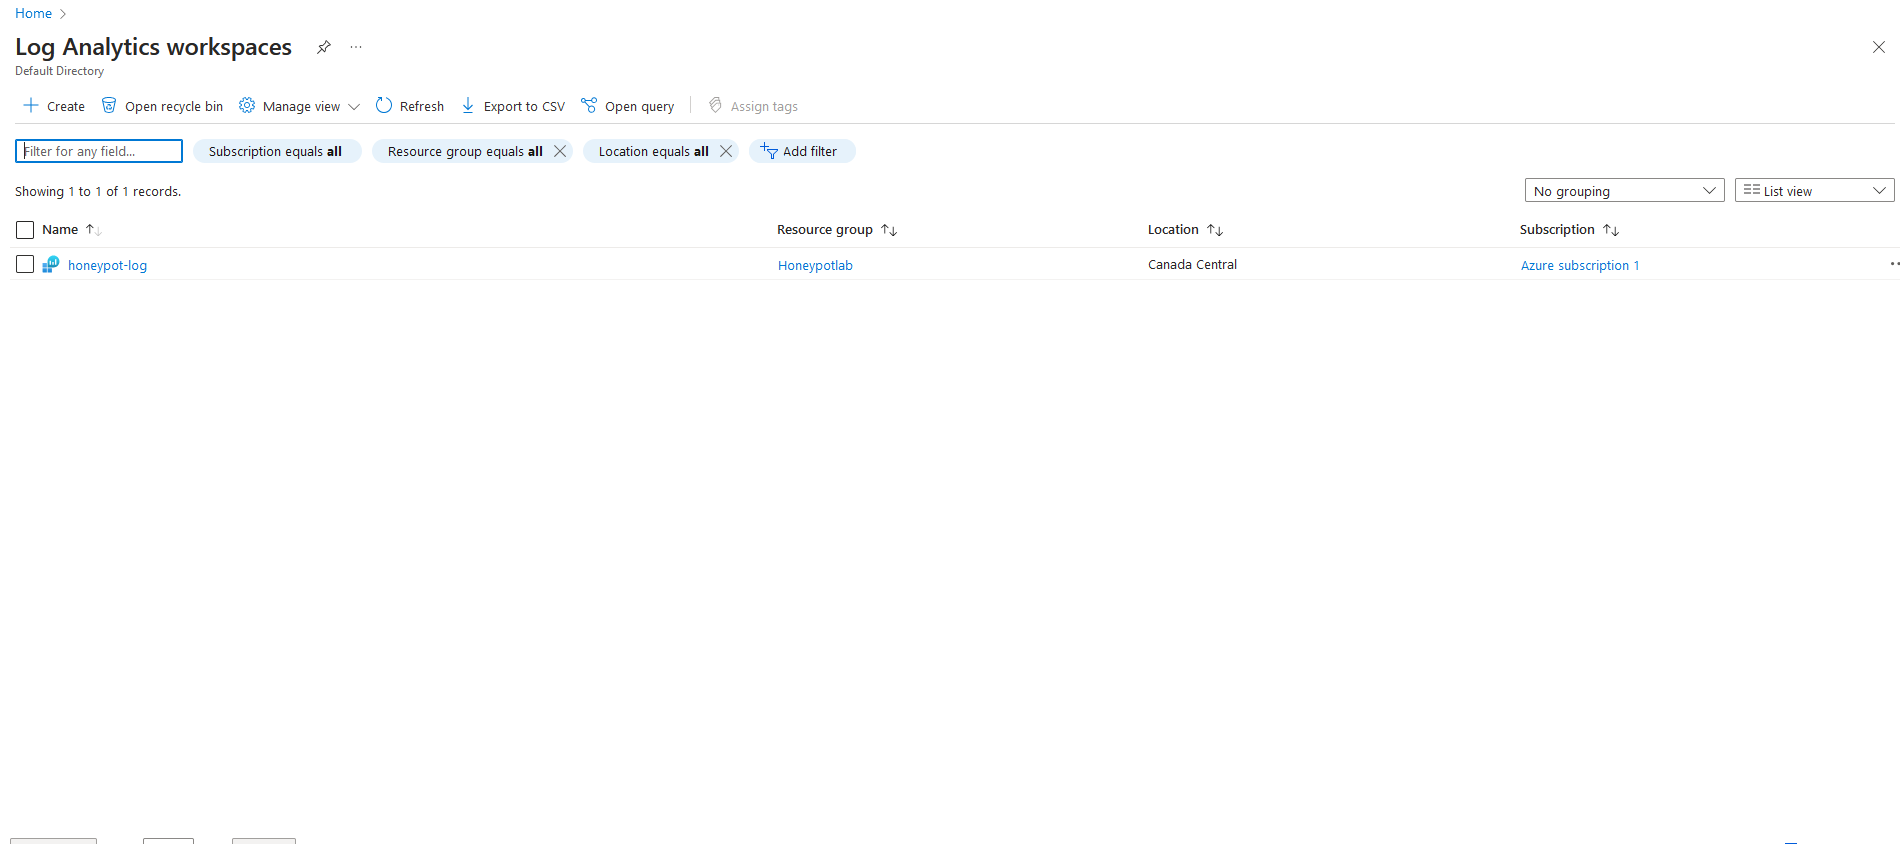
3a. Search for 'Log analytics workspaces in the search bar, and click on it
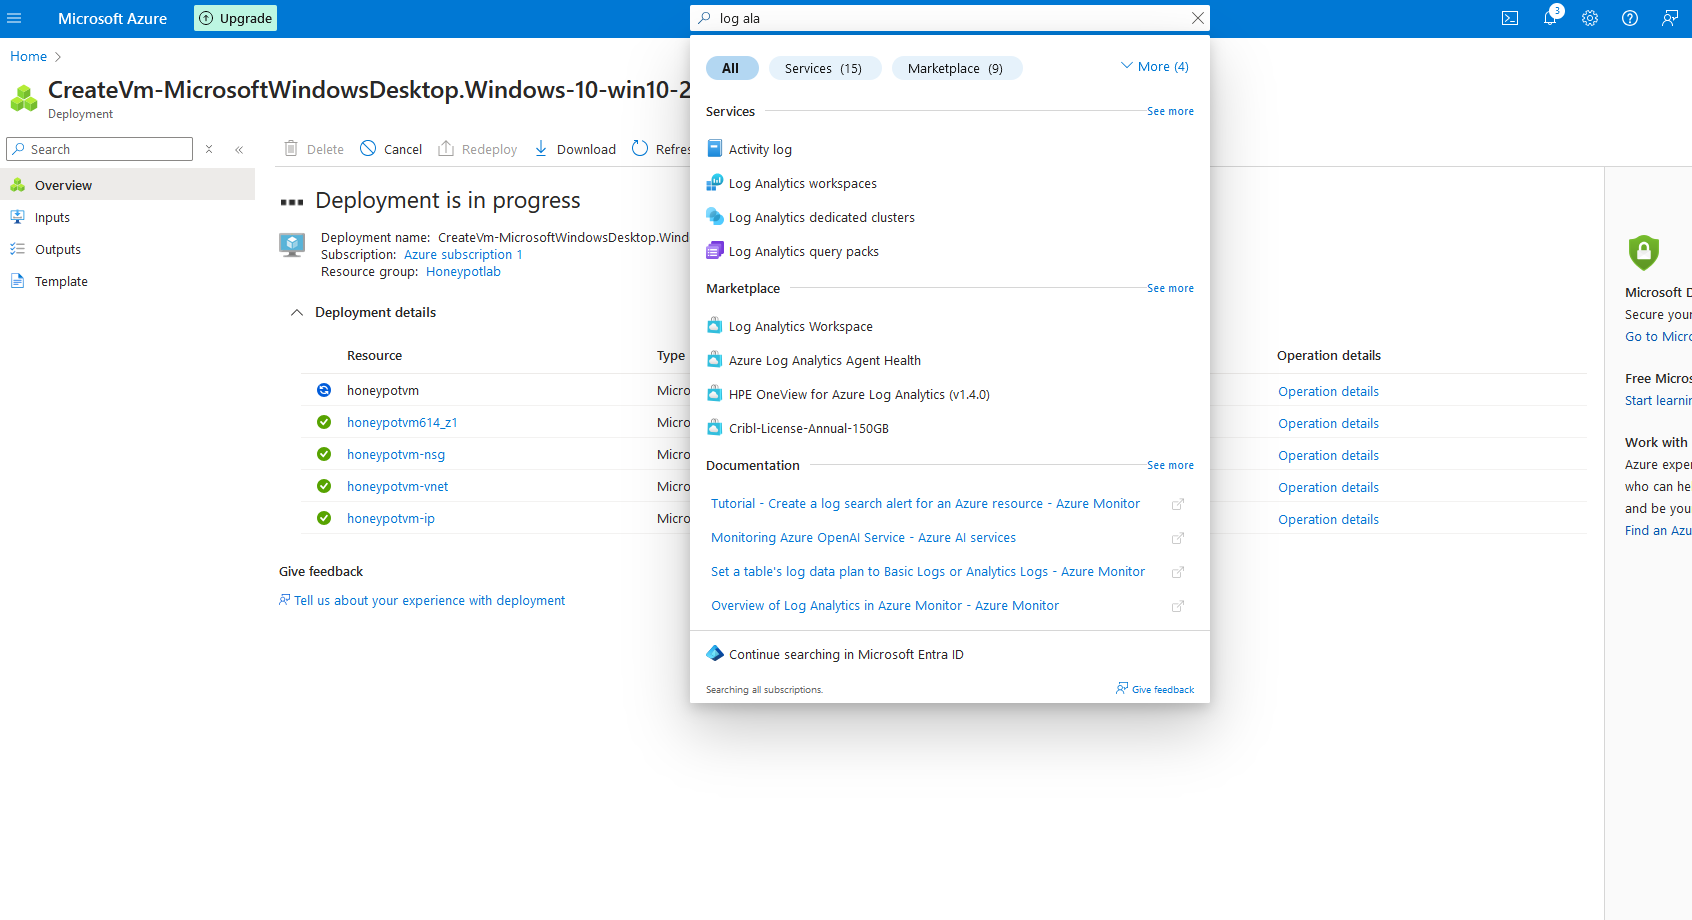
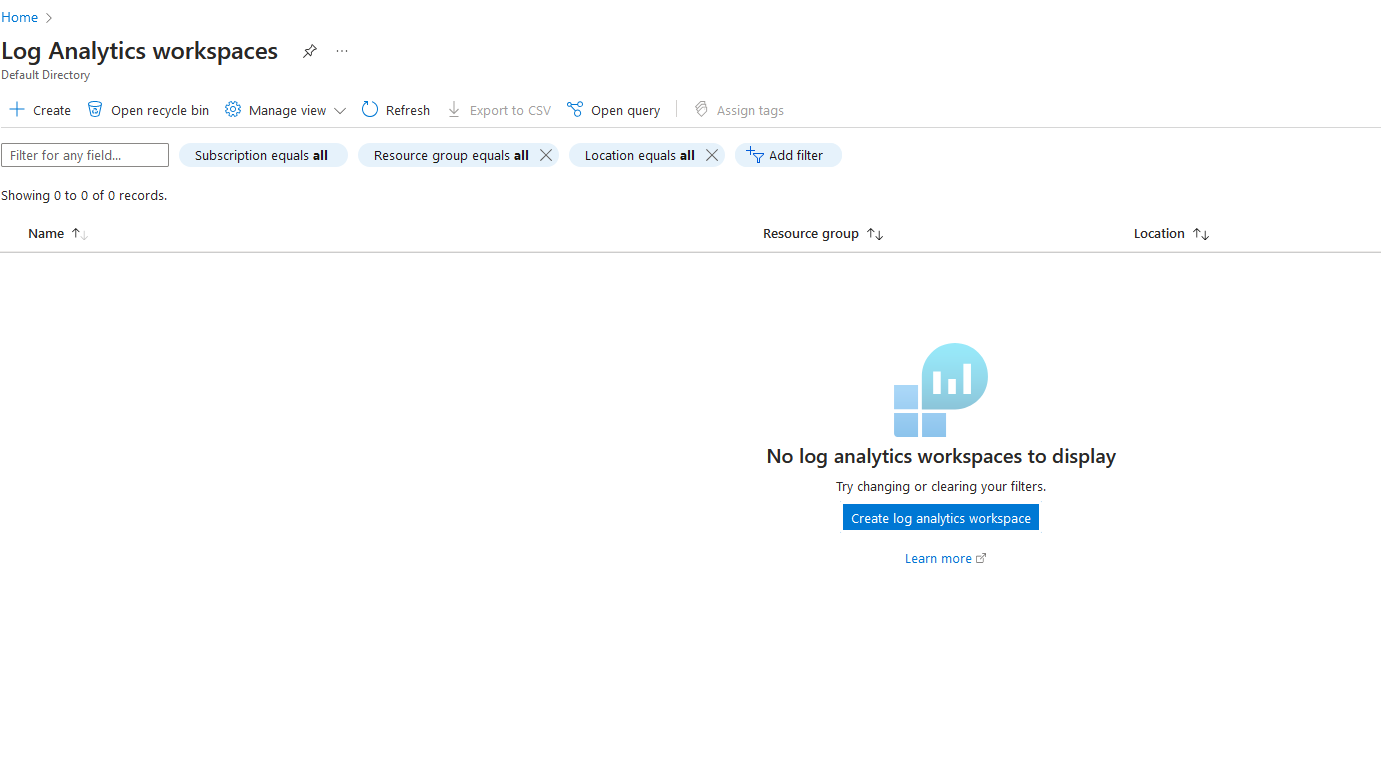
3b. Click on "Create log analytics workspace"
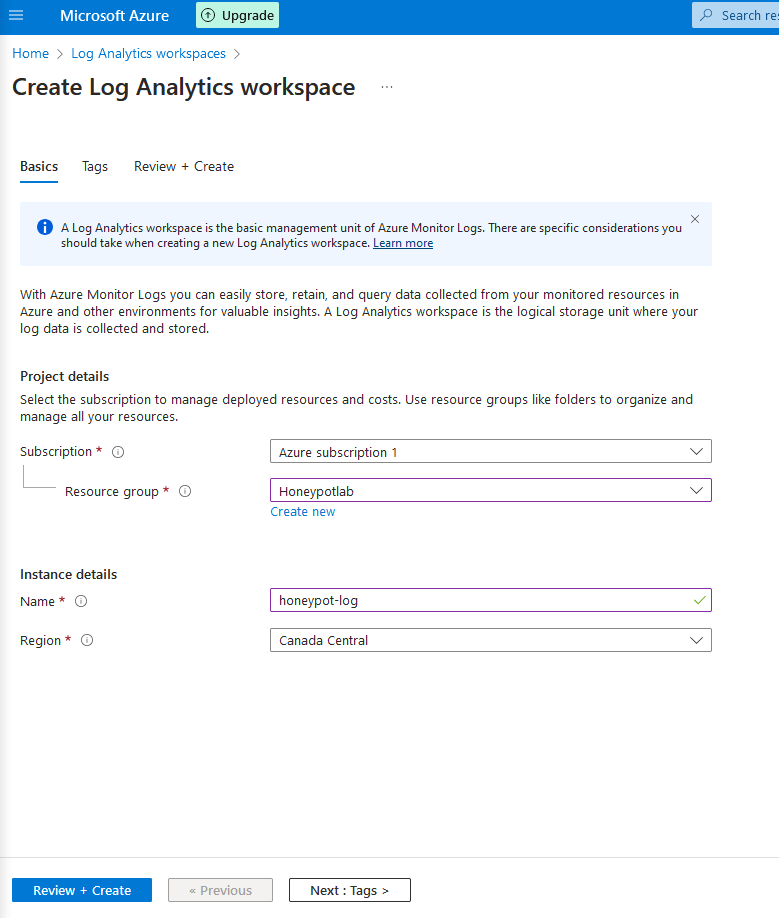
3c. Select the resource group you created earlier, and call the log whatever you want. I'm naming mine "honeypot-log". Then after choosing your region, hit "Review + Create", then "Create"
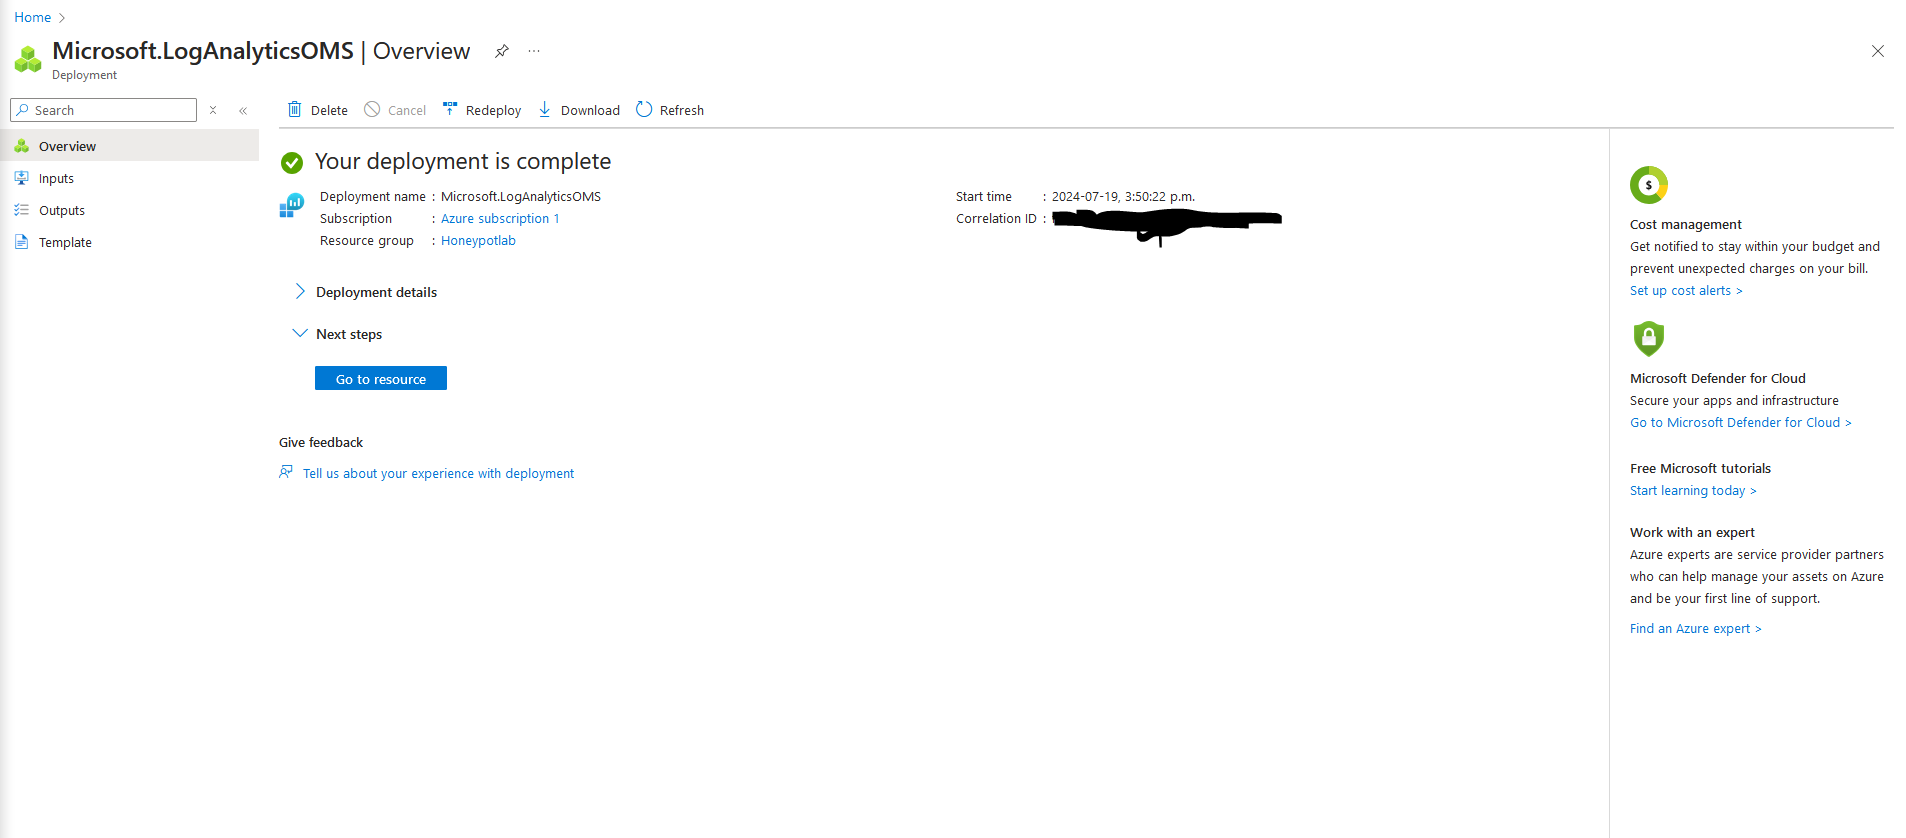
3d. Next, we need to enable our security center to gather logs from the virtual machine. To do this, search for "Microsoft Defender for Cloud', or click on it on the right side of the screen.
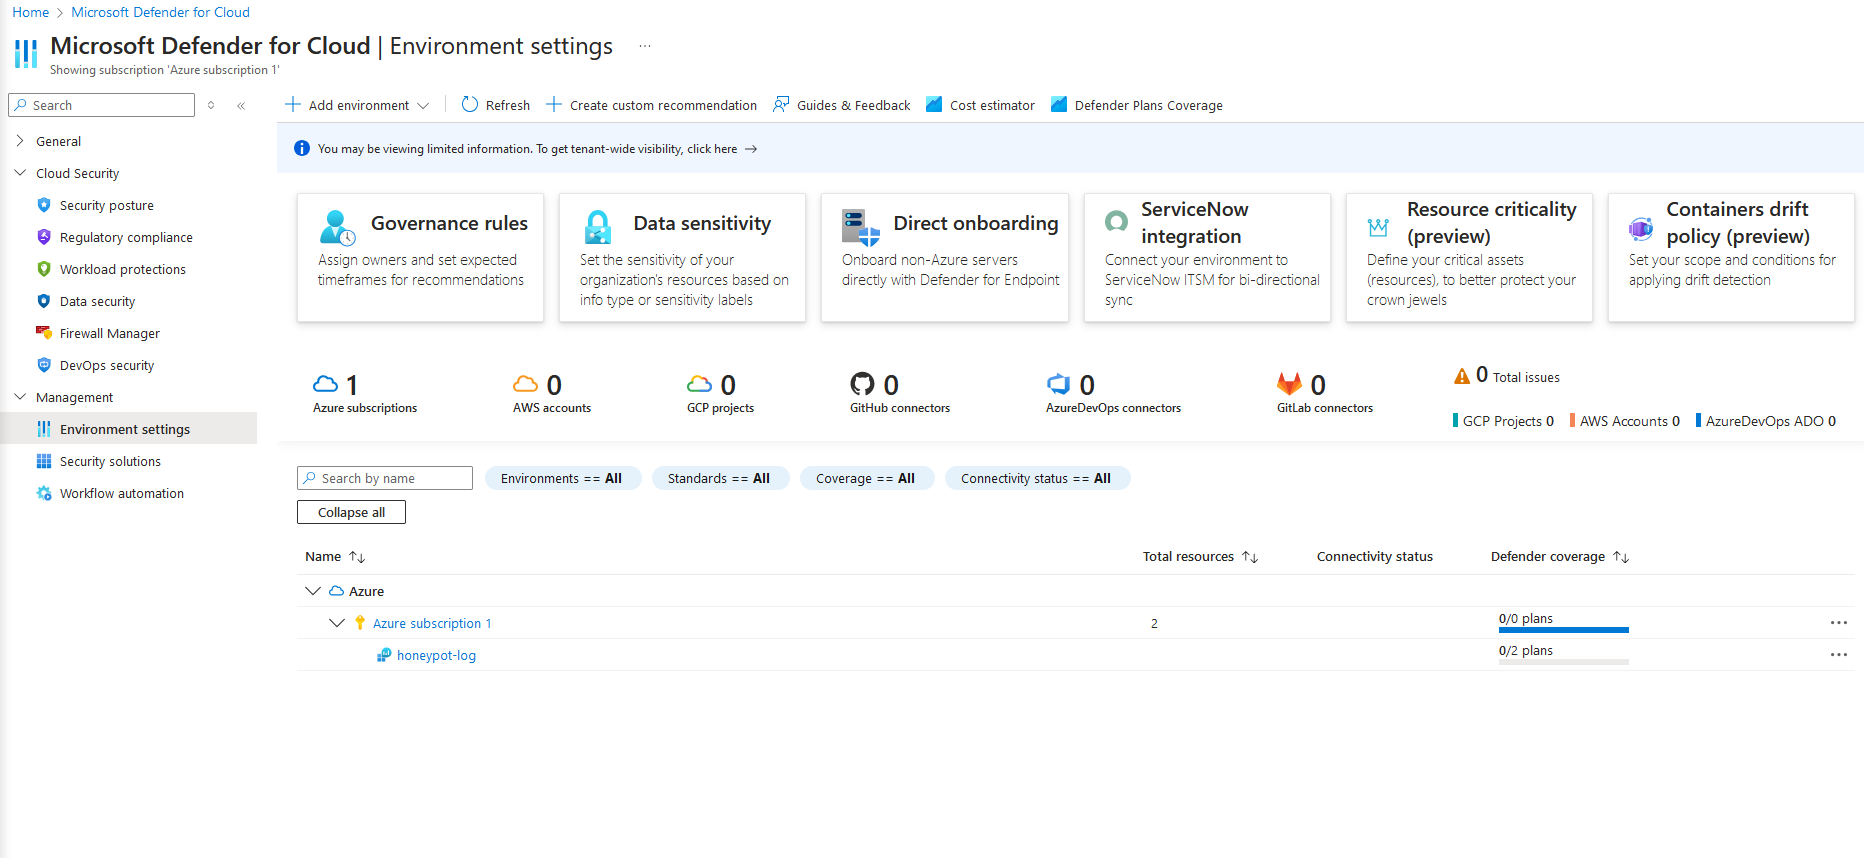
3e. In the left hand bar, under 'Management' click on "Environment settings", then under your subscription , click on the honypot log you just created.
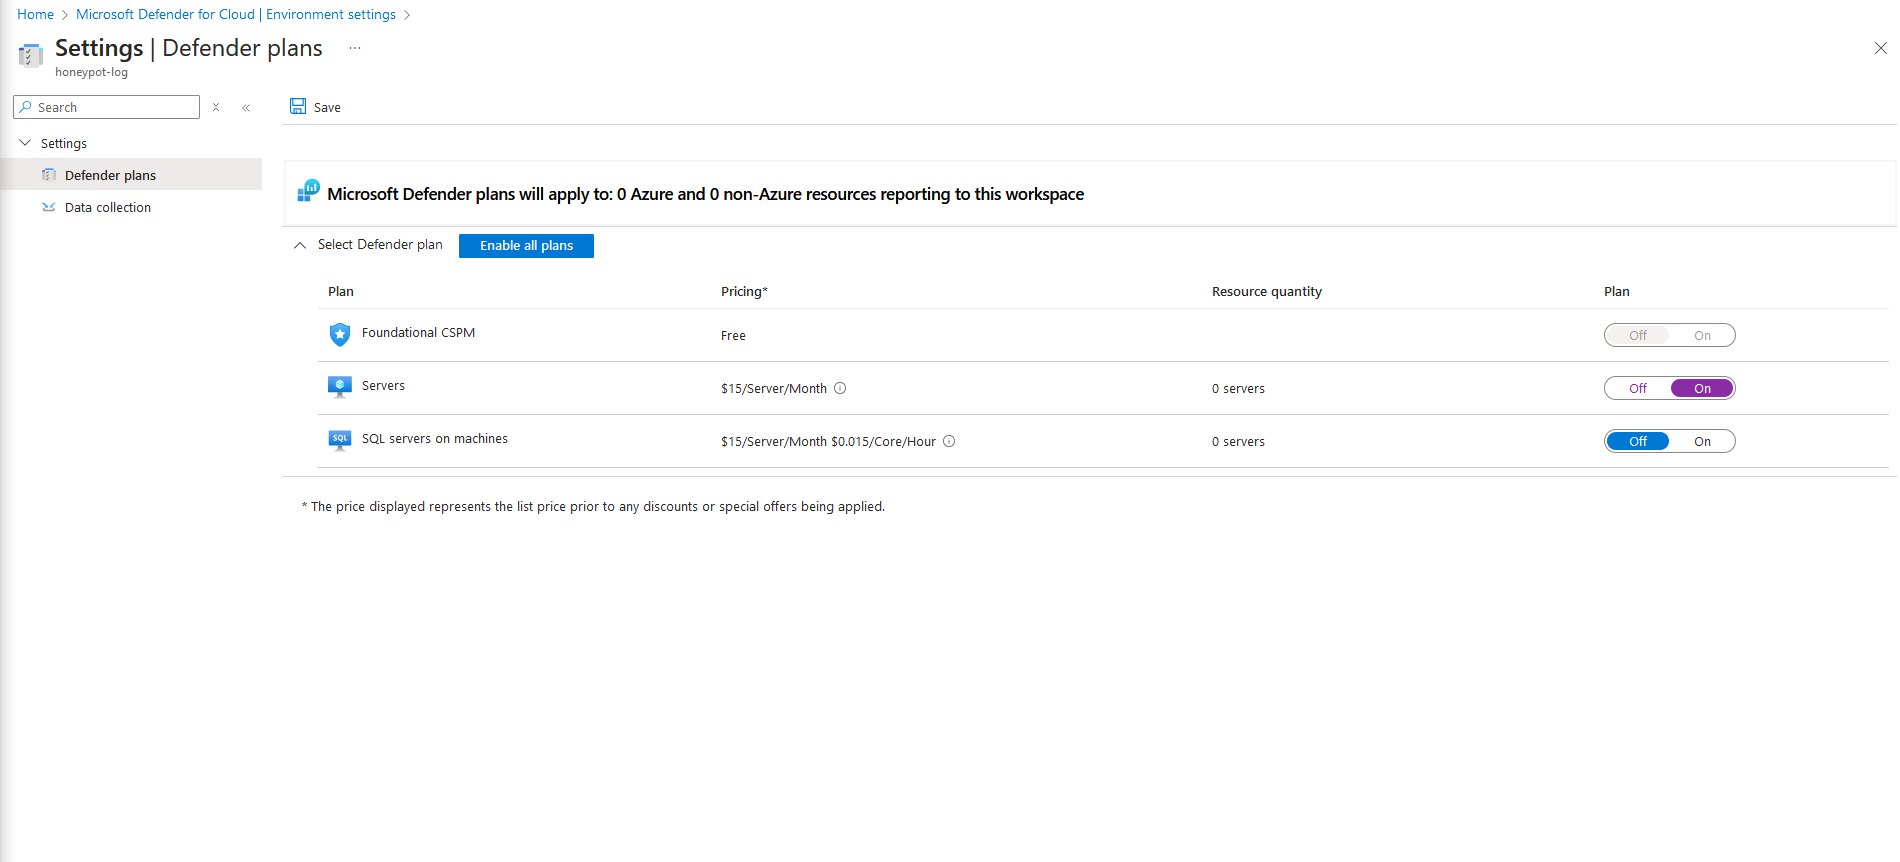
3f. Enable servers for the defender plan, but keep SQL disabled, then click "Save"
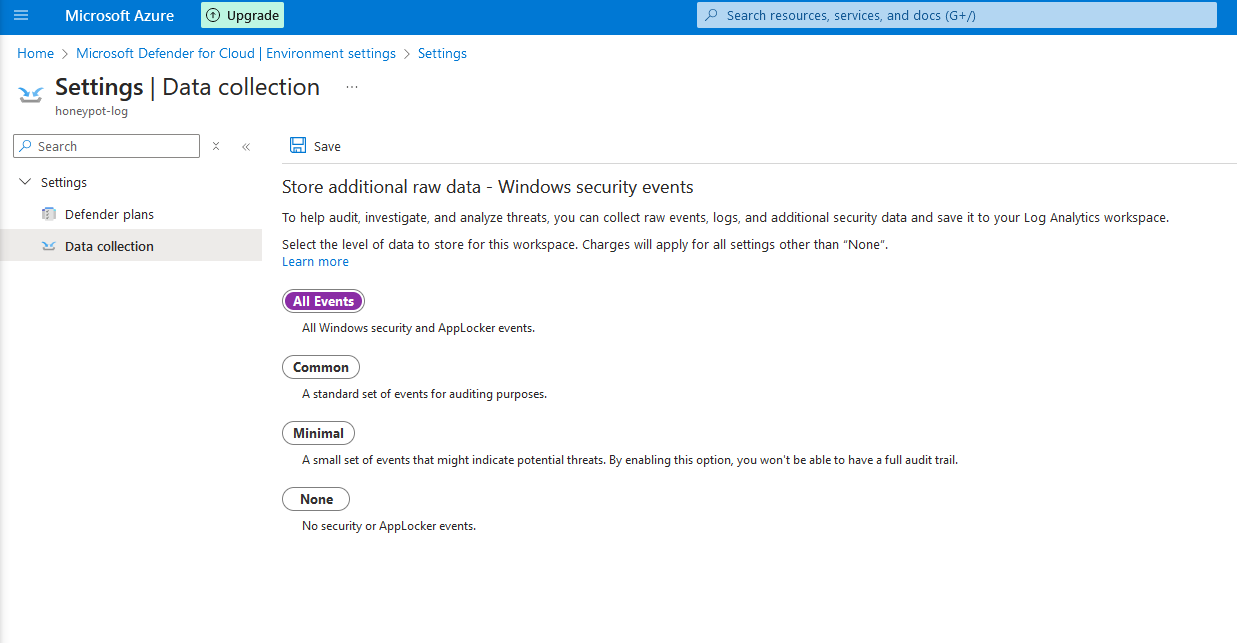
3g. Next, click on "Data Collection", then select "All events". Then click "Save"
3h. Now return to the log analytics workspace, click on you workspace, then search for "Virtual Machines"
*** (note that this method is deprecated and will not be supported from august 31st, 2024. This method can be used until august 24th 2024, but it's advised to migrate to "Azure Monitor Agent" )
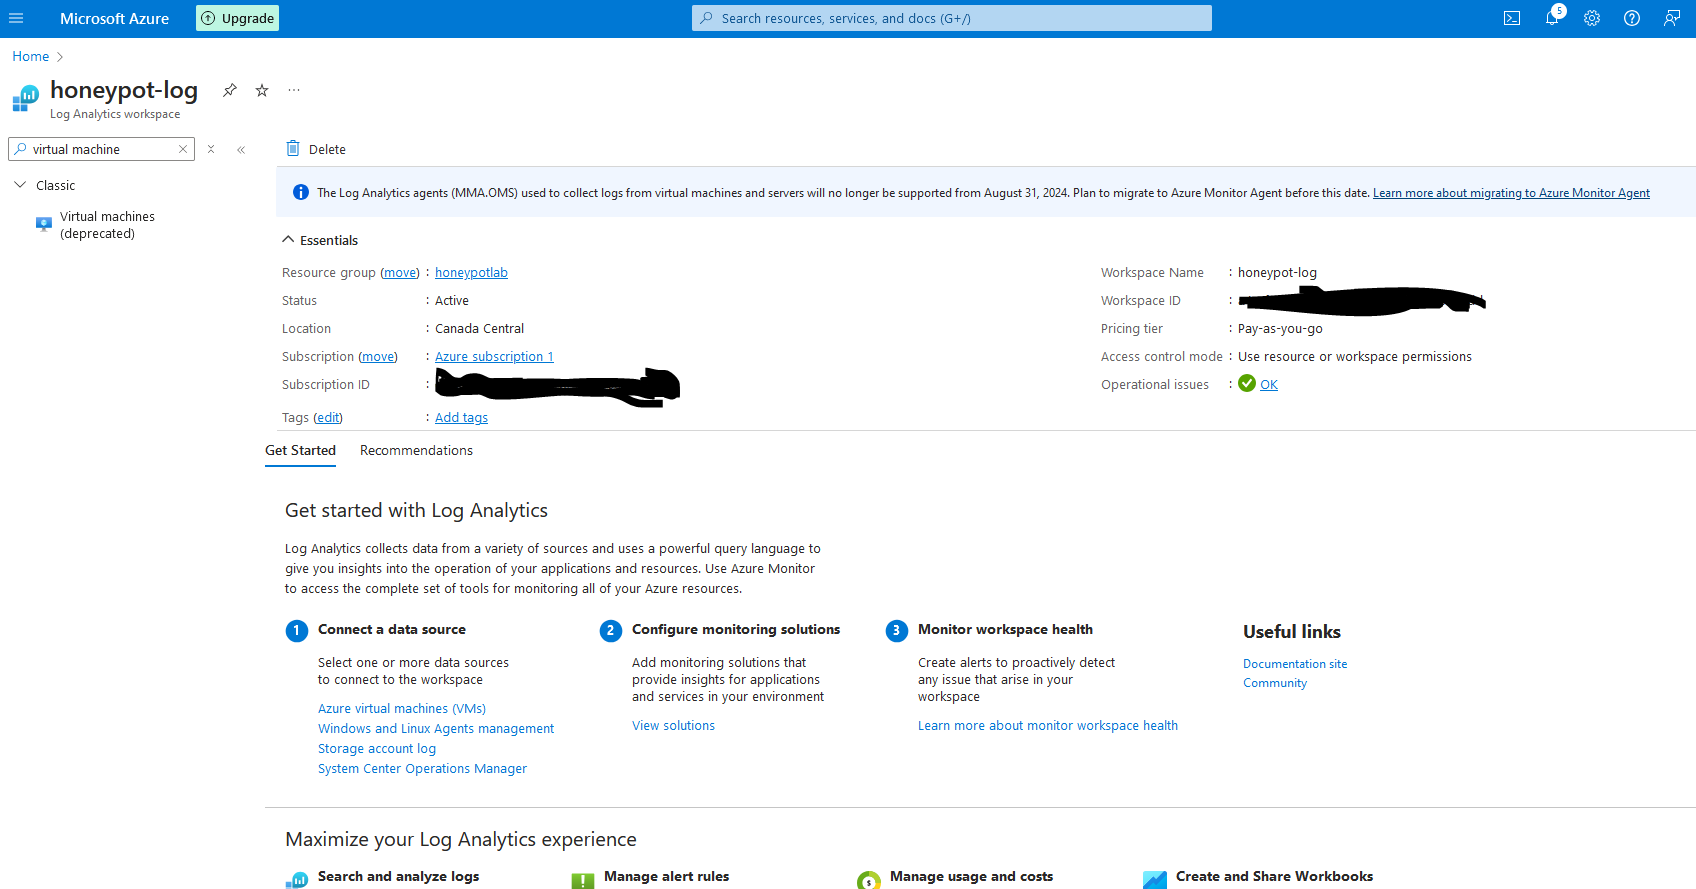
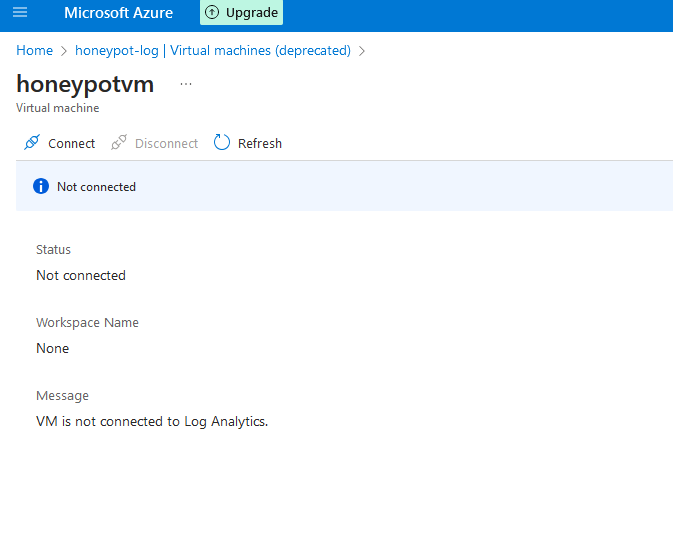
3i. Click on your honeypot VM, and click "Connect". Now that our log is set up, we can proceed to the next phase
Step 4 - Setup Microsoft Sentinel
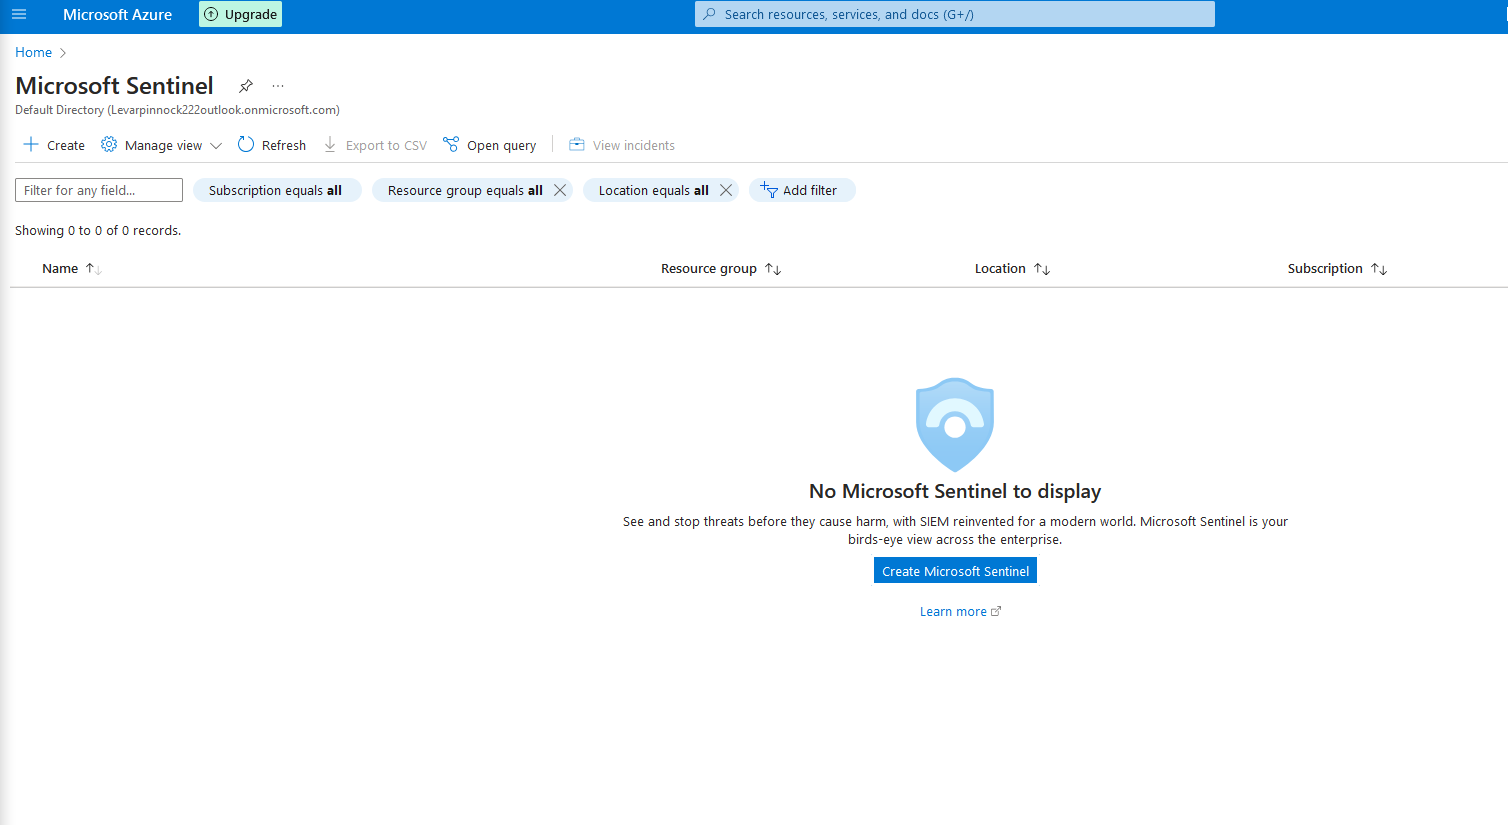
4a. Search for "Microsoft Sentinel", then from there click on it, and then click "Create Microsoft Sentinel"
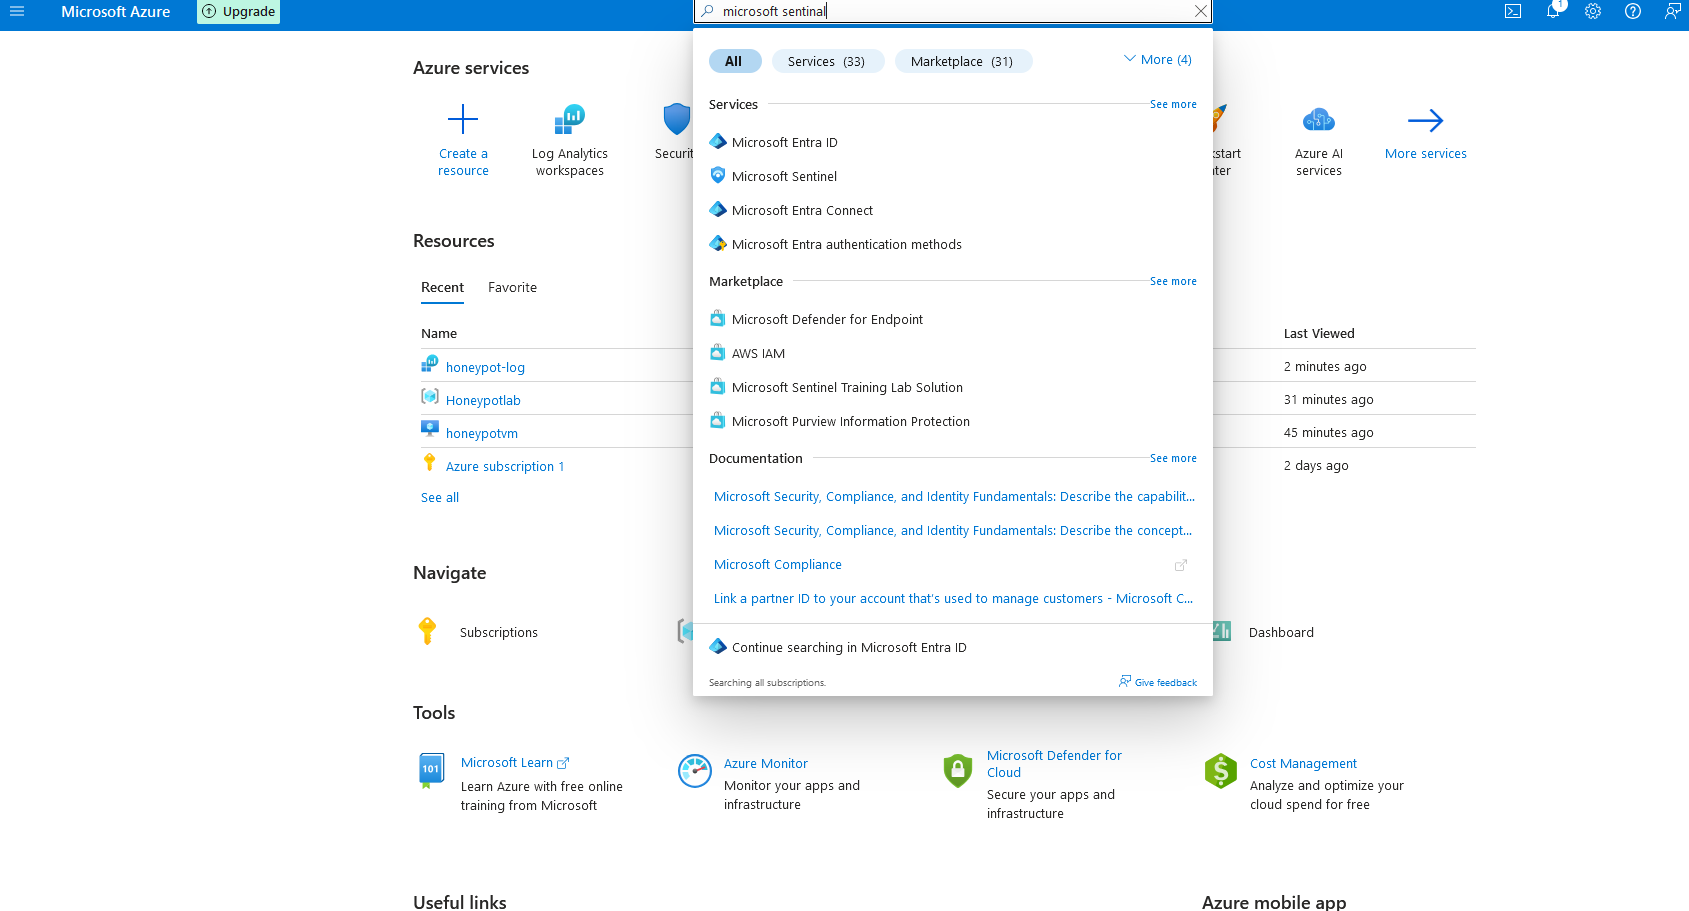
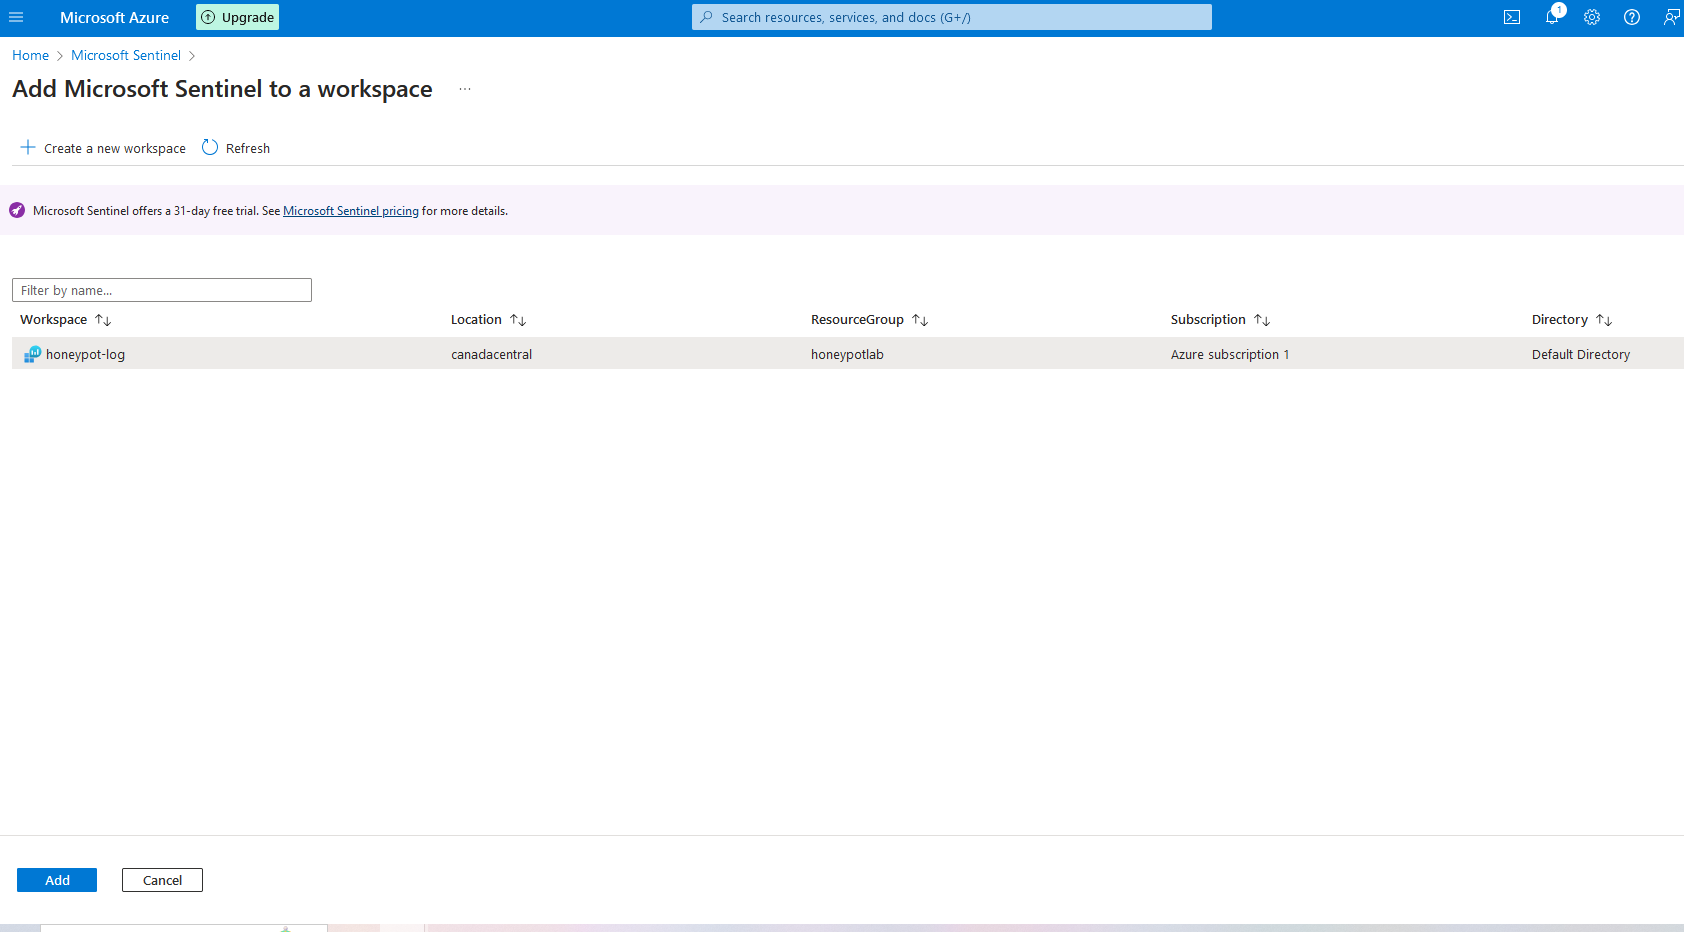
4b. Click on your workspace, then click "Add"
Step 5 - Accessing and Configuring the VM
5a. On your actual computer (assuming you're on windows) open the Remote Desktop Application. Enter the public IP address of your VM in the computer field, and then the username you set earlier. Click connect, then it will ask for the password. Enter the password, then accept the certificate, and let the machine log in. This may take a while depending on the specs used
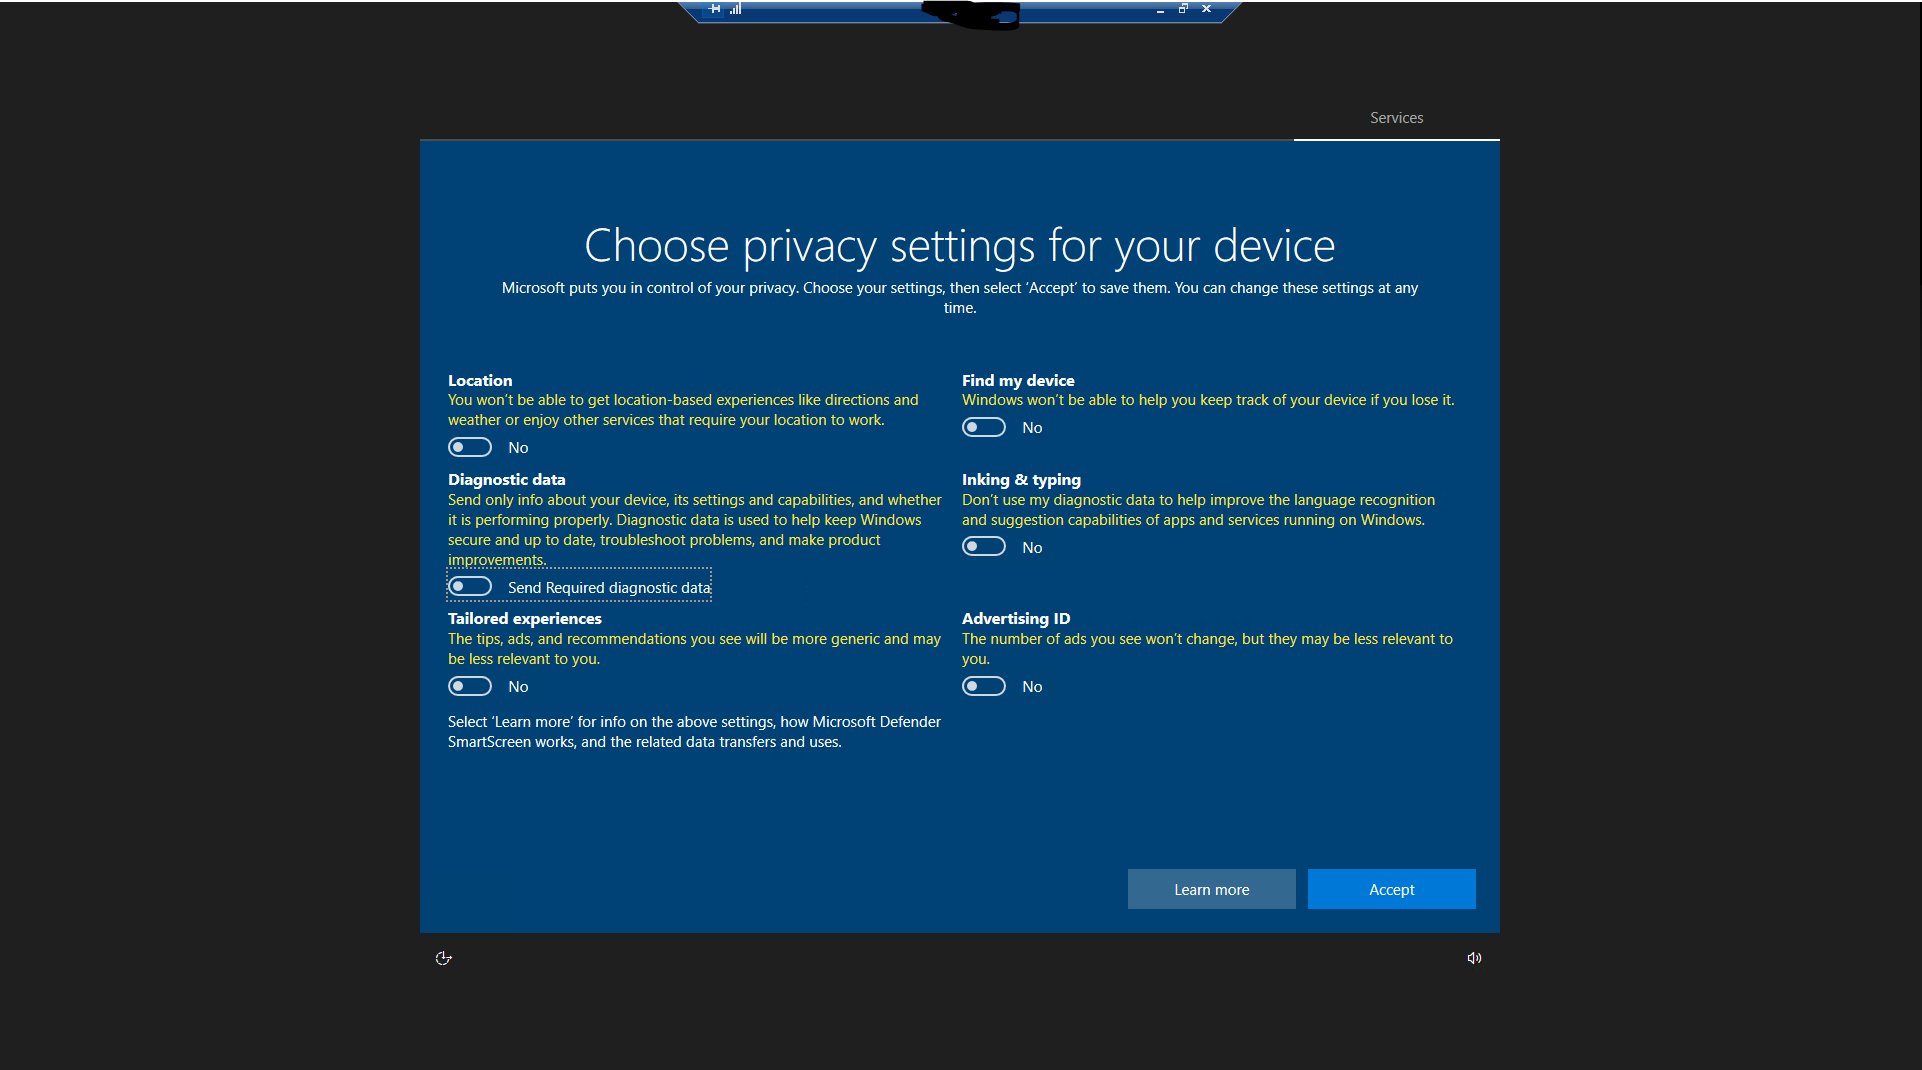
5b. Once you login to the VM for the first time, slide all the options on the screen to "NO and hit accept
5c. If asked , enable network discovery, then open edge to begin setting it up, as it will be used later
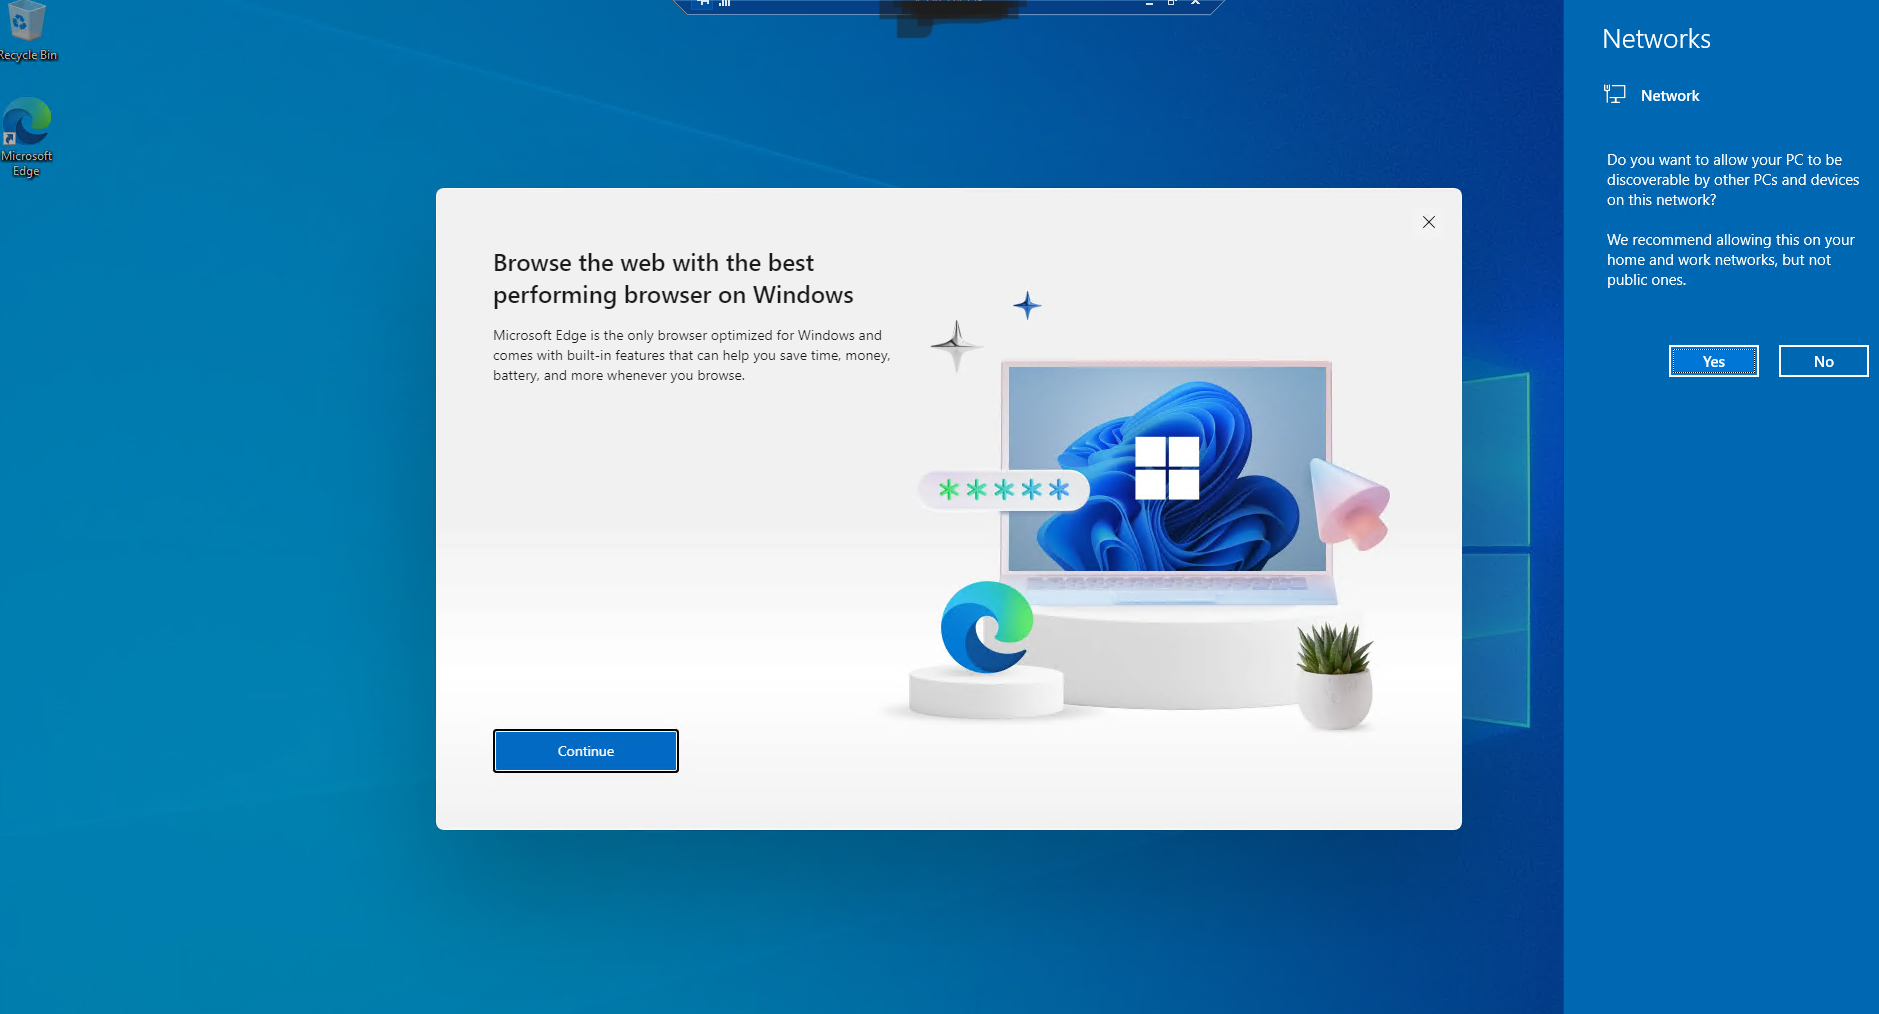
5d. select "start without your data'' when setting up microsoft edge, then click confirm and continue. Uncheck "make edge more fun to you" and then click confirm. You can now close the edge browser on your VM
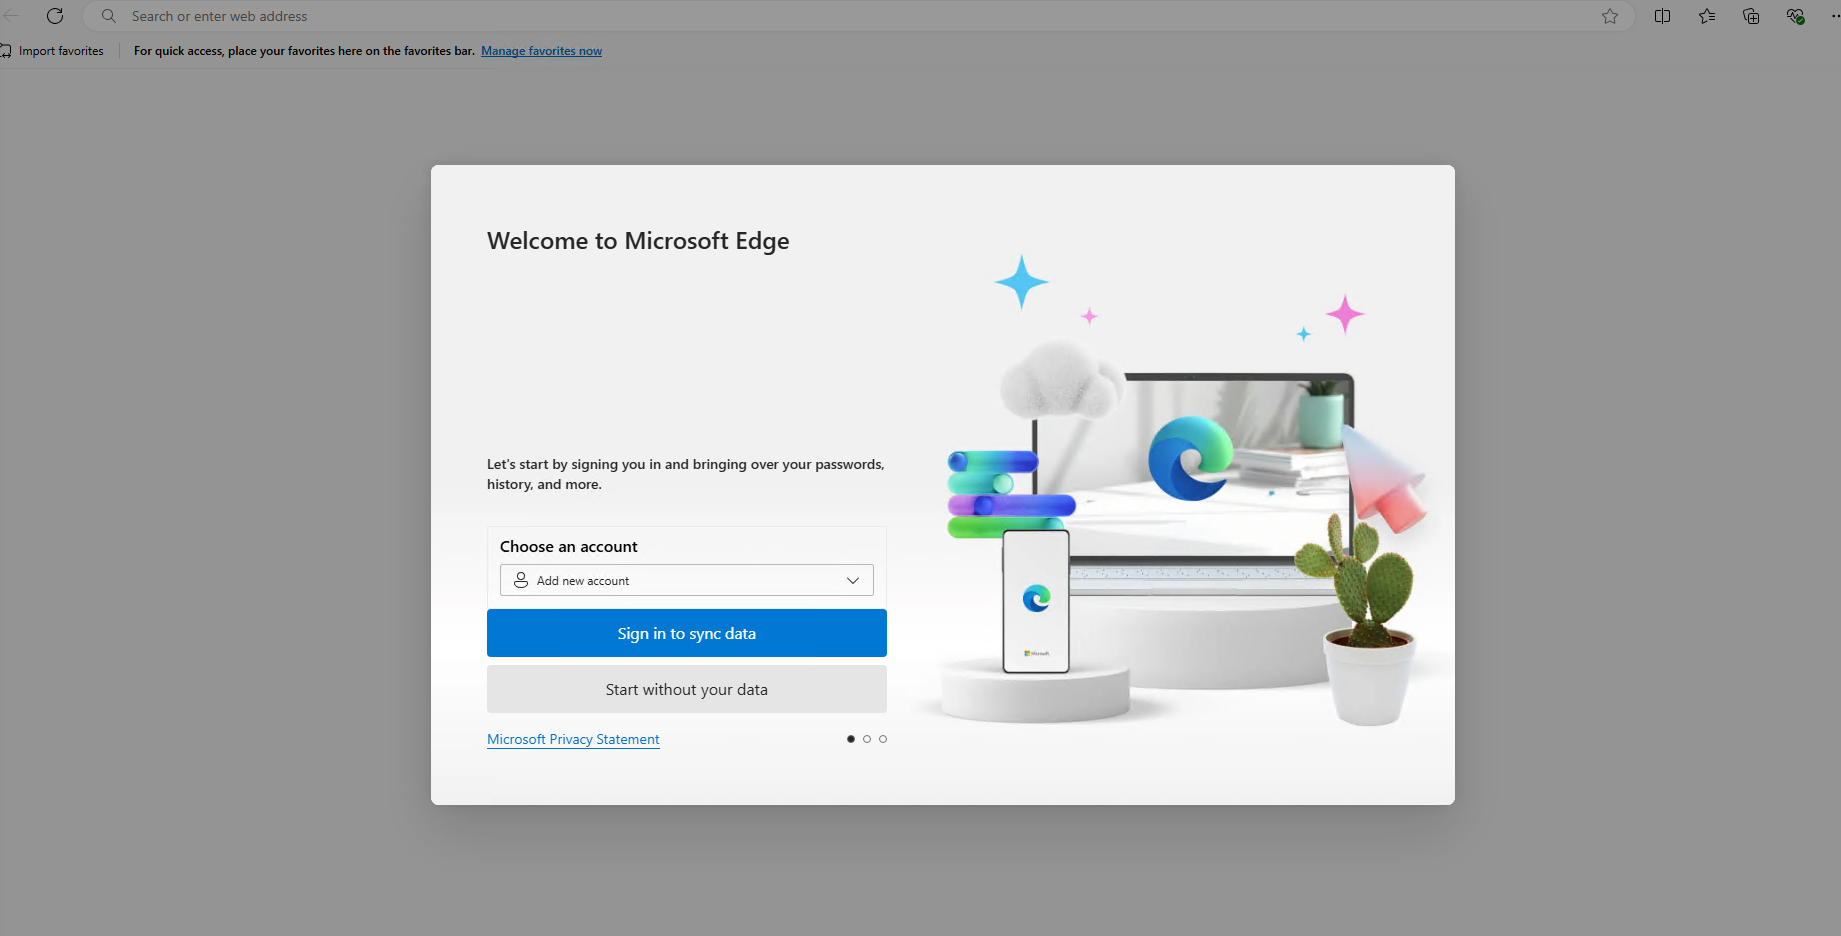
5e. Lastly, you will need to turn the firewall off on the honeypot vm, to make it an easier target. Search for "wf.msc" in the search bar of the VM, and open it
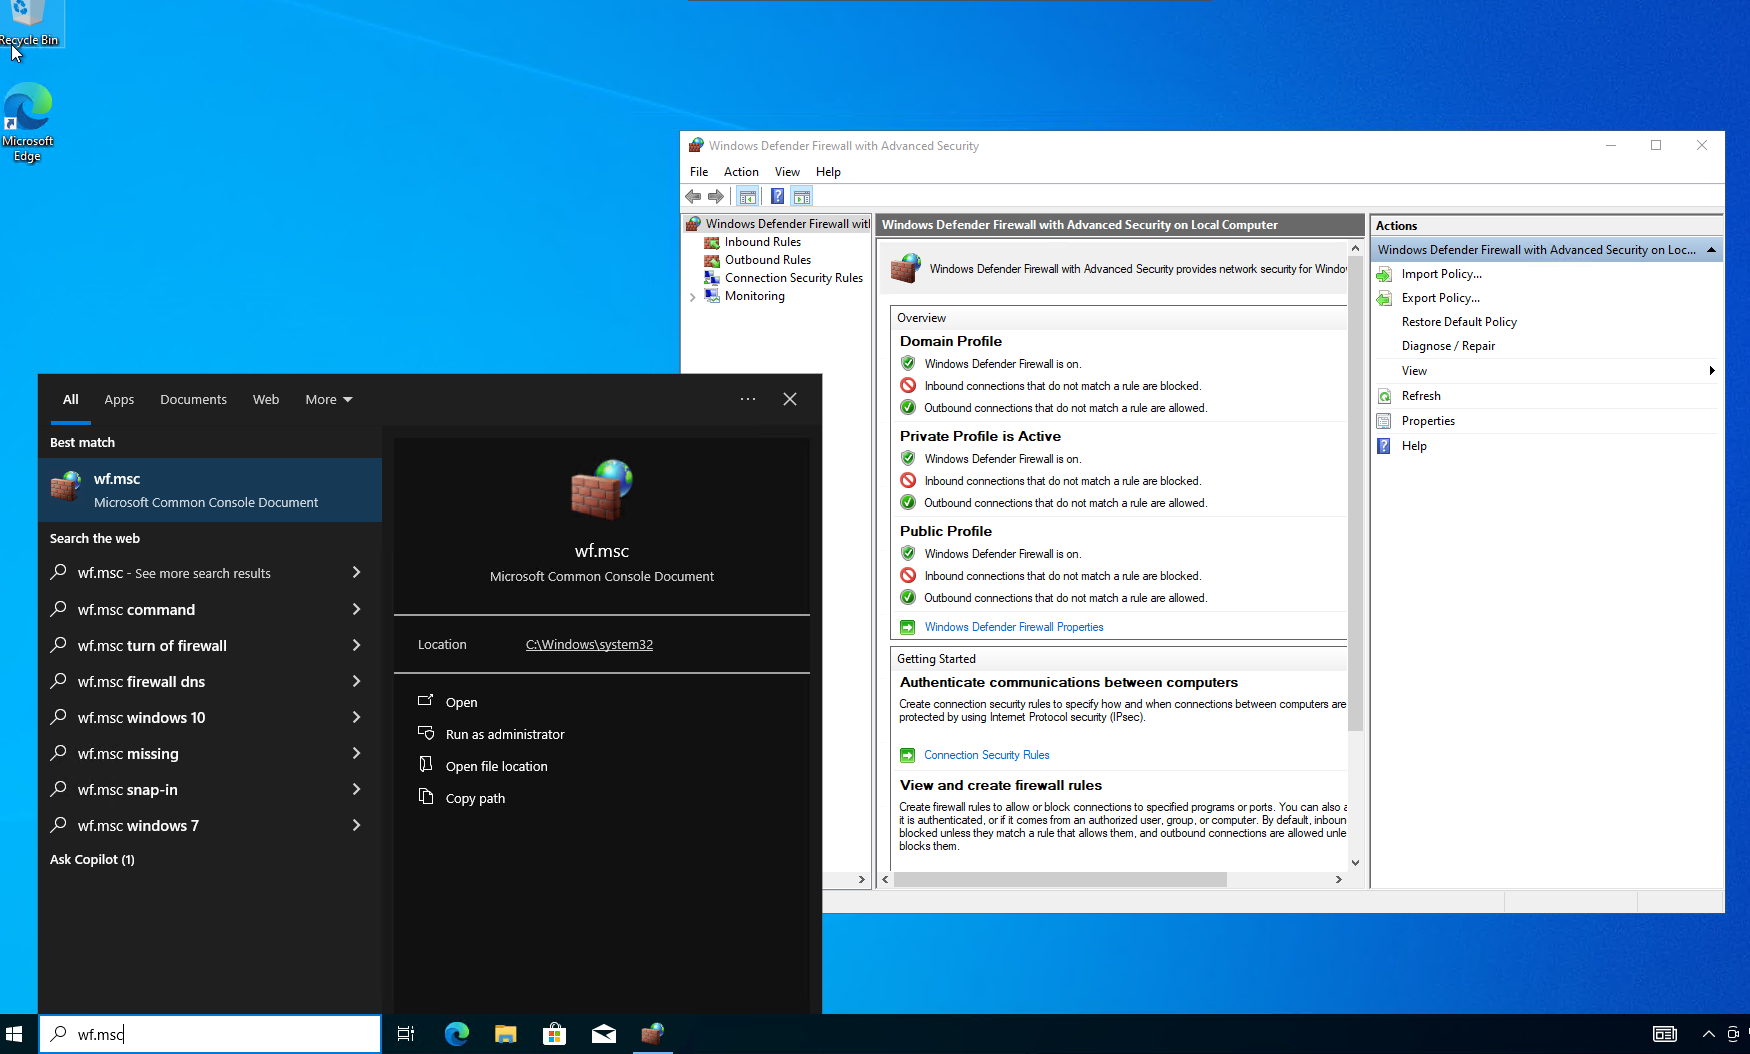
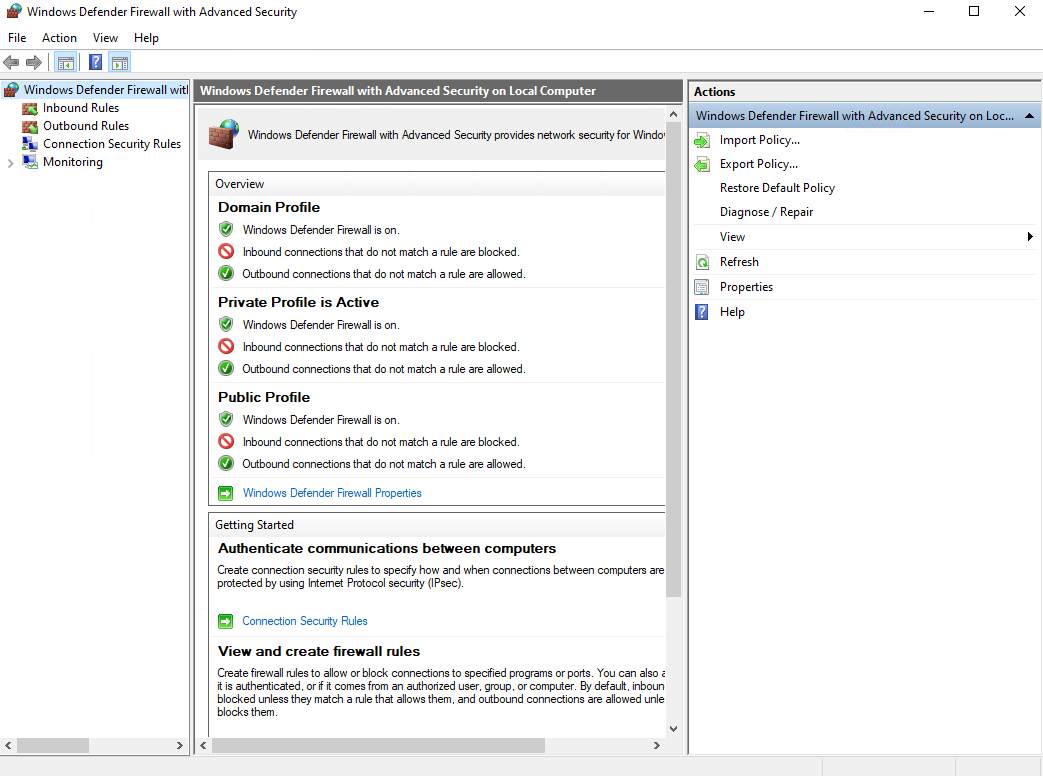
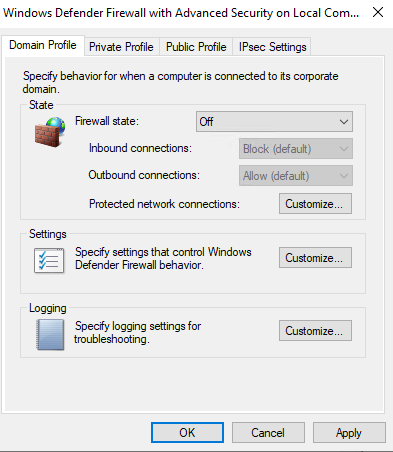
5f. Click on "Windows Defender Firewall Properties" , then go to Domain profile, and turn the firewall off. Do the same for the private and public profiles. Hit apply and ok.
Step 6 - Downloading and Installing Bash Scripts (for Geo-location integration)
6a. Download the Script onto the virtual machine by clicking here, then go to https://ipgeolocation.io/ and click "Get free API Access"
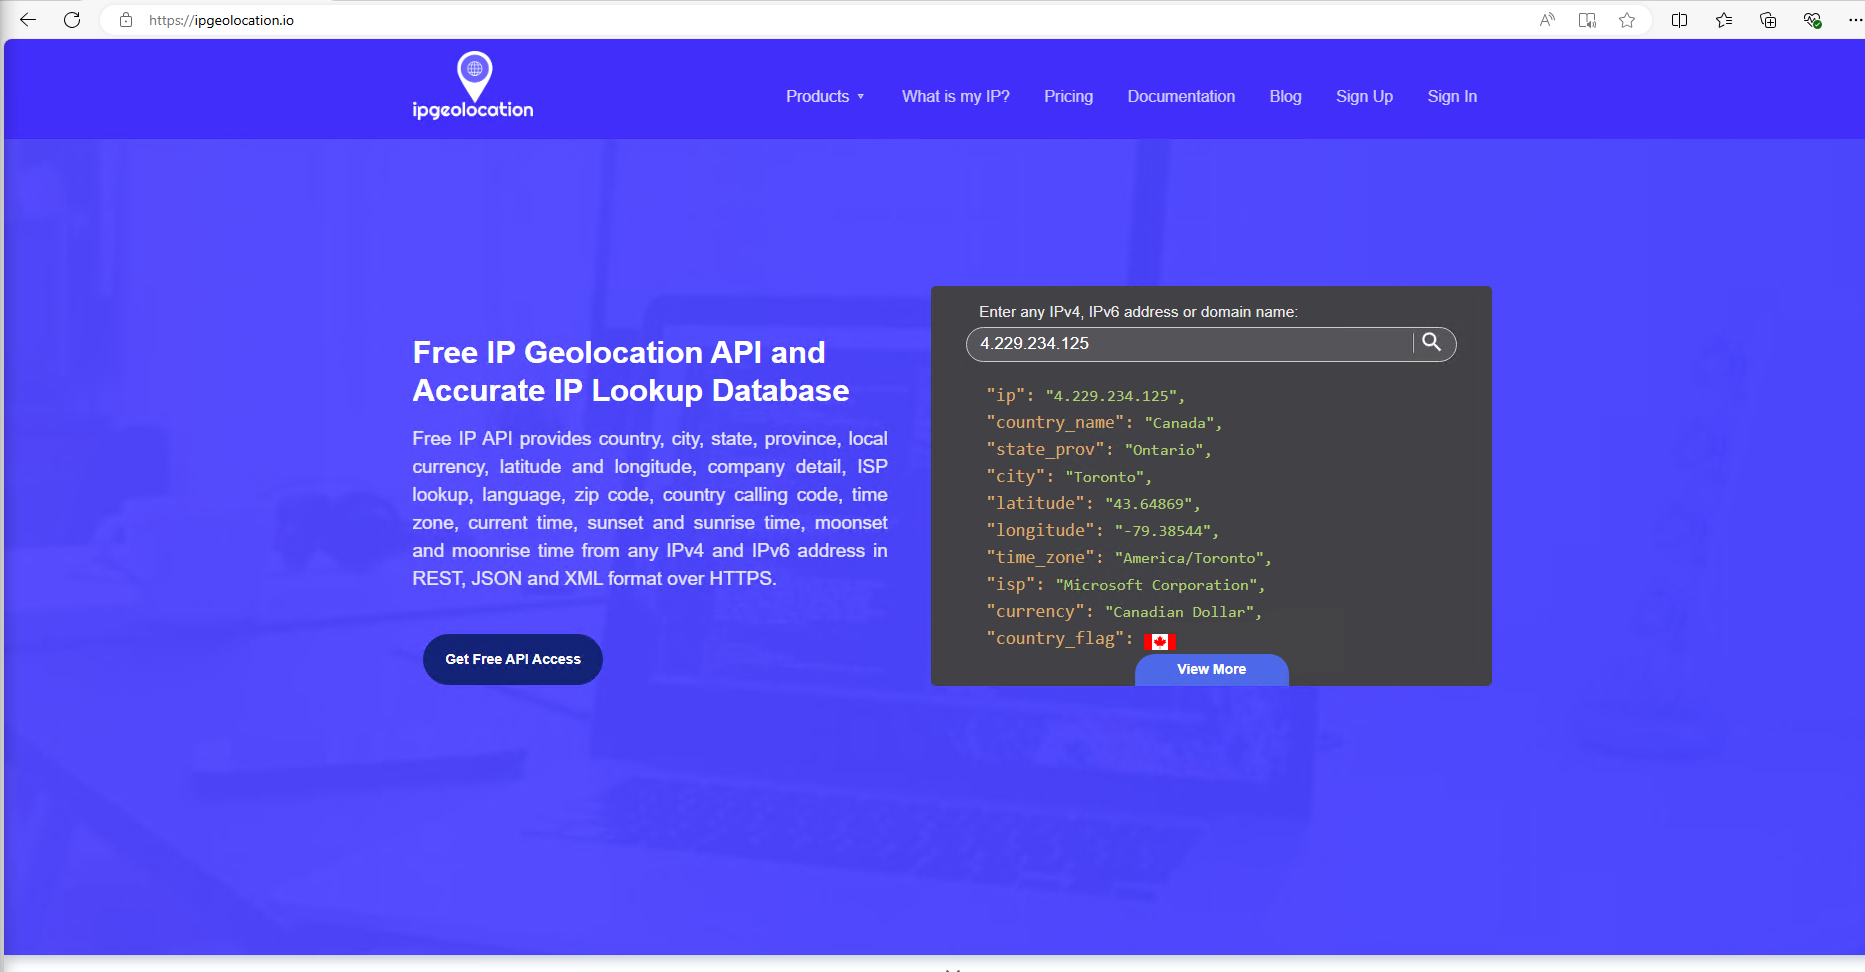
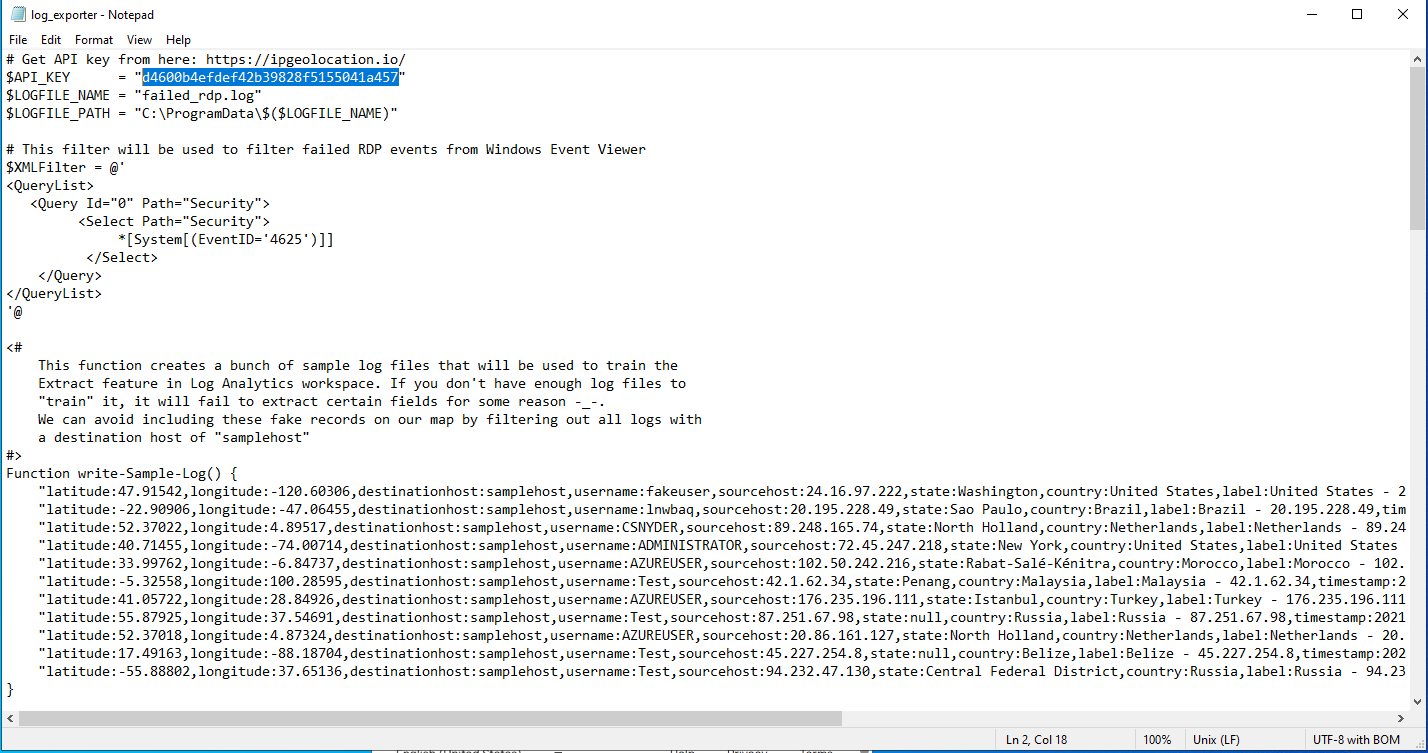
6b. Register with the website. After you've created and verified your free account, copy the API key on your dashboard, then paste it into the "$API_KEY" field, replacing what's already there. Save then close the file.

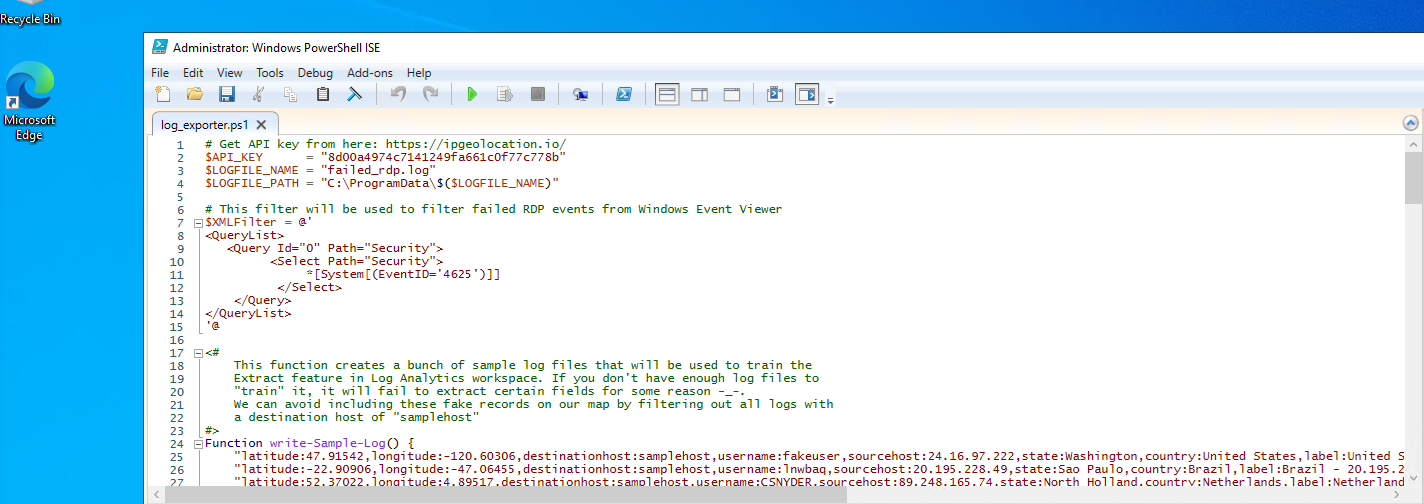
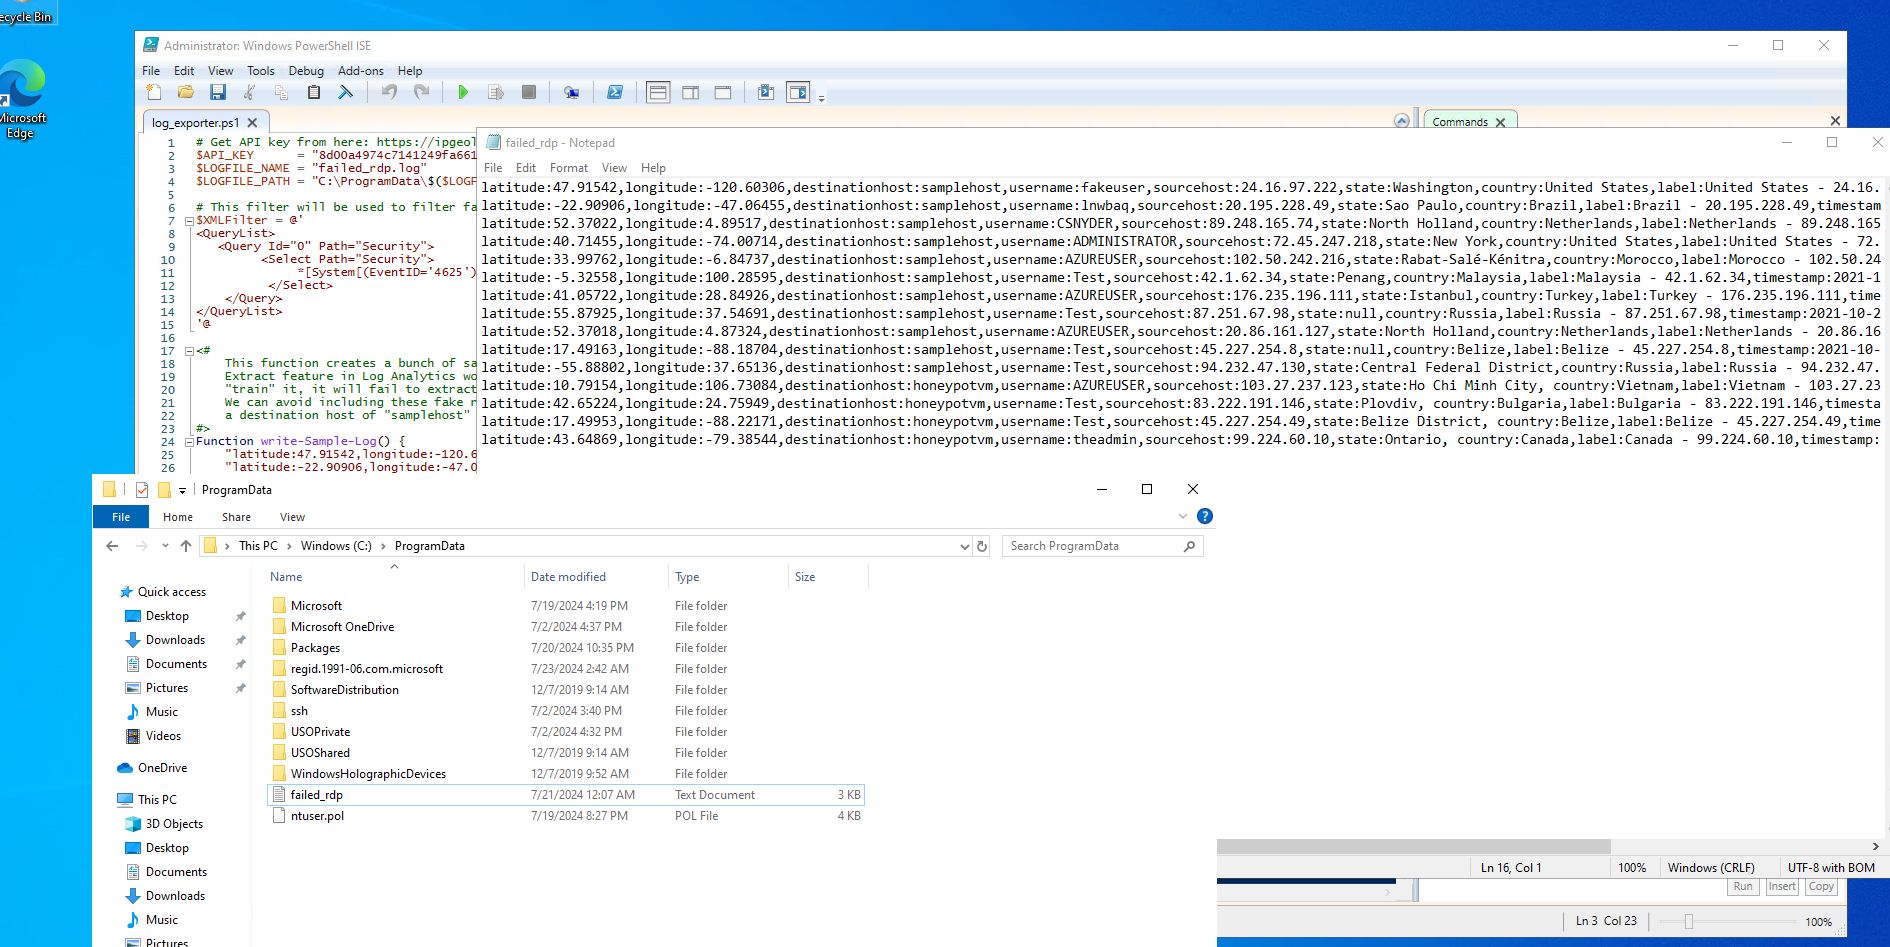
6c. Run the script, then go to "C:/ProgramData/yourfilehere" to open the file output.
6d. Copy the output of the script into a text file and save it on your actual computer, not the virtual machine. This will be used later.
Step 7 - Integrating custom logs into our Logs analytics workspace
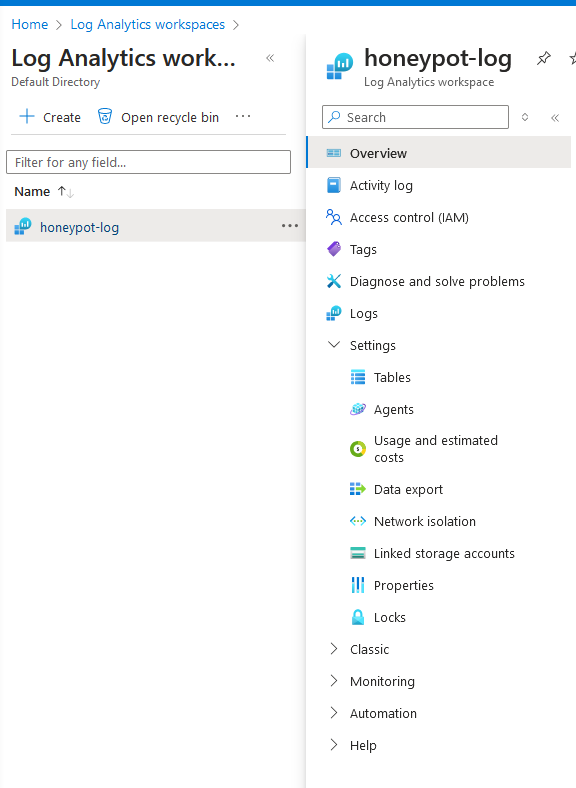
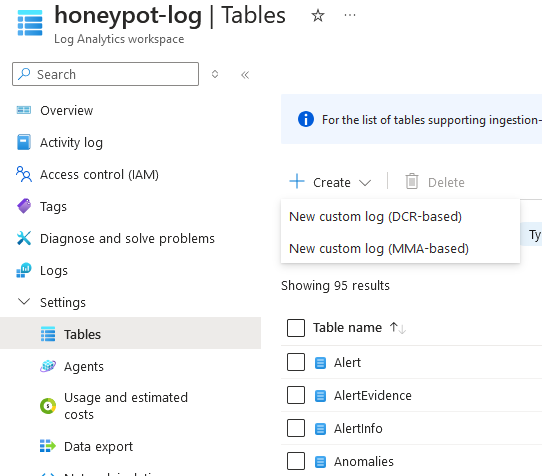
7a. Go to log analytics, then go to settings, then "Tables"
7b. Click on "Create, then "New custom log (MMA -Based)
7c. Select the .txt file with the copied script output from the VM
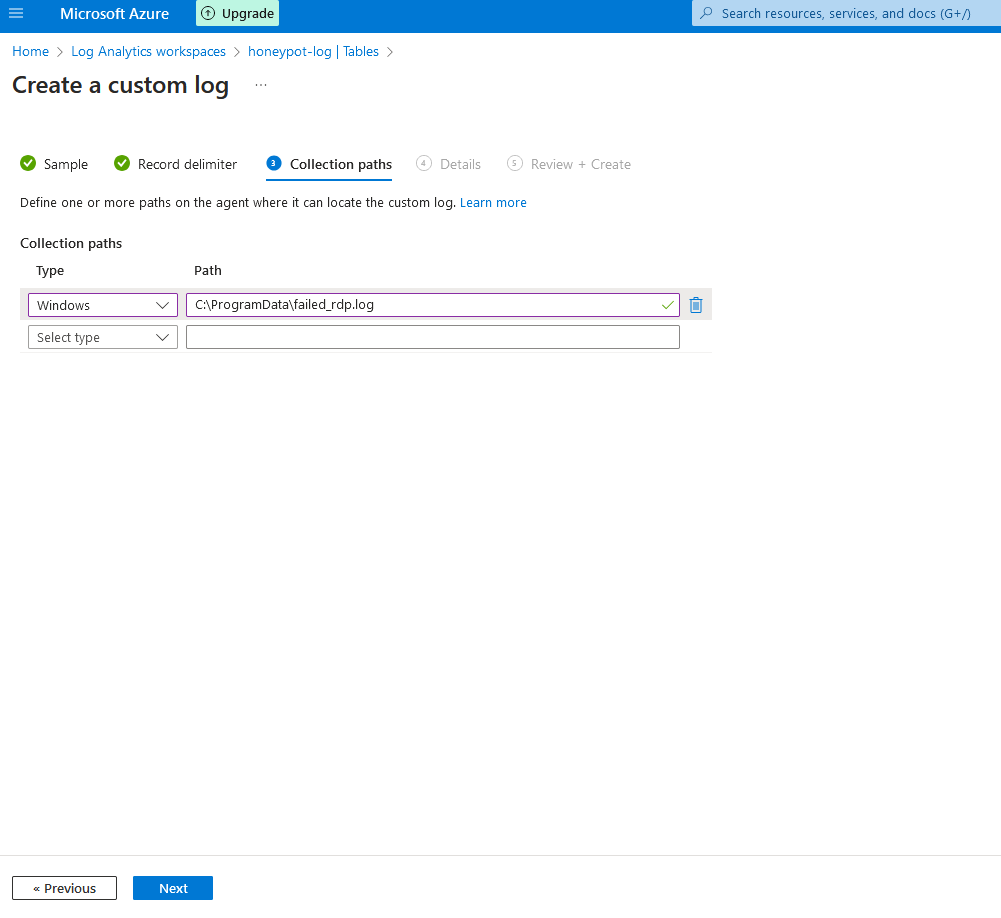
7d. Hit next twice, then at collection paths, enter the url of the output file from the VM, and select "windows" for collection paths. Then hit next
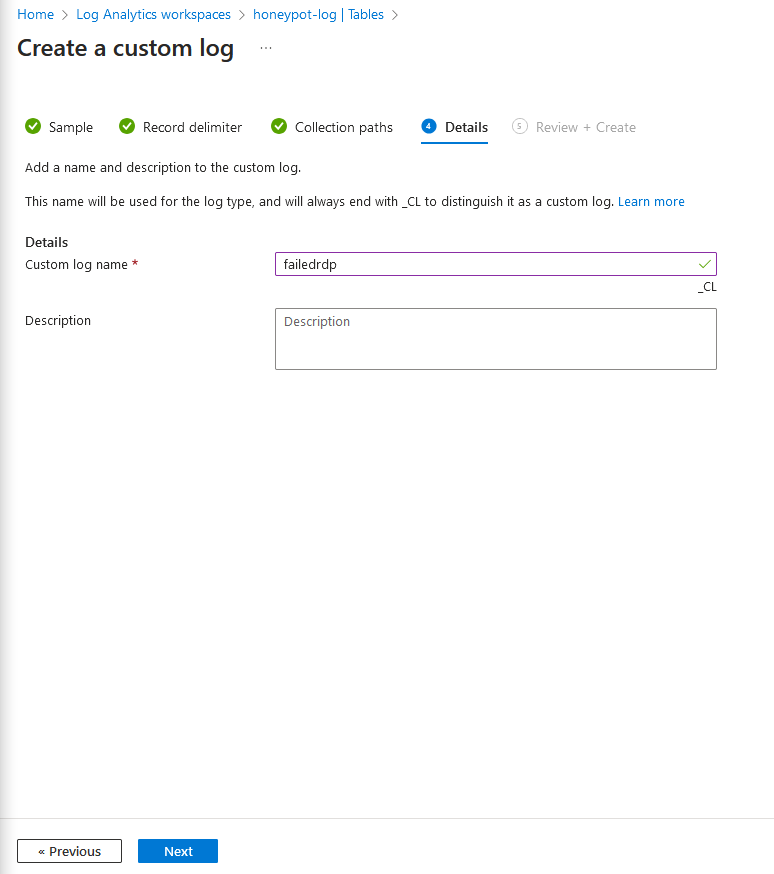
7e. Name the log whatever, then click "next", then, "create"
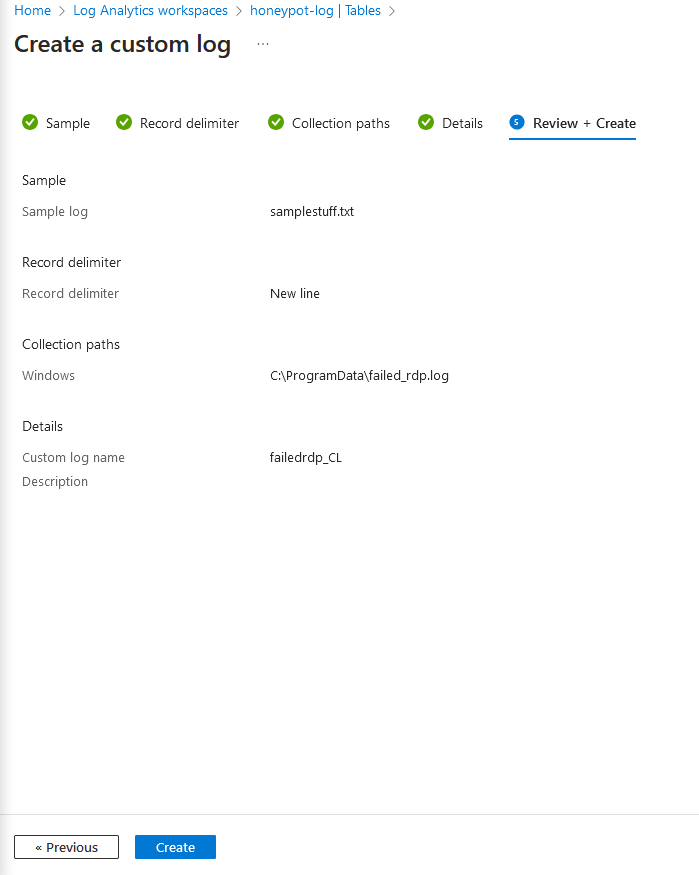
7f. If successful, you should now be able to search for your table by typing the name of the file you created, then hitting run
Step 8 - Extracting Data fields from Custom logs
8a. Copy the following code into the query scope:
    YourCustomLog_CL
| project TimeGenerated, RawData
| extend Latitude = extract(@"latitude:([^,]+)", 1, RawData)
| extend Longitude = extract(@"longitude:([^,]+)", 1, RawData)
| extend DestinationHost = extract(@"destinationhost:([^,]+)", 1, RawData)
| extend UserName = extract(@"username:([^,]+)", 1, RawData)
| extend SourceHost = extract(@"sourcehost:([^,]+)", 1, RawData)
| extend State = extract(@"state:([^,]+)", 1, RawData)
| extend Country = extract(@"country:([^,]+)", 1, RawData)
| extend Label = extract(@"label:([^,]+)", 1, RawData)
| extend Timestamp = extract(@"timestamp:([^,]+)", 1, RawData)
| project TimeGenerated, Latitude, Longitude, DestinationHost, UserName, SourceHost, State, Country, Label, Timestamp
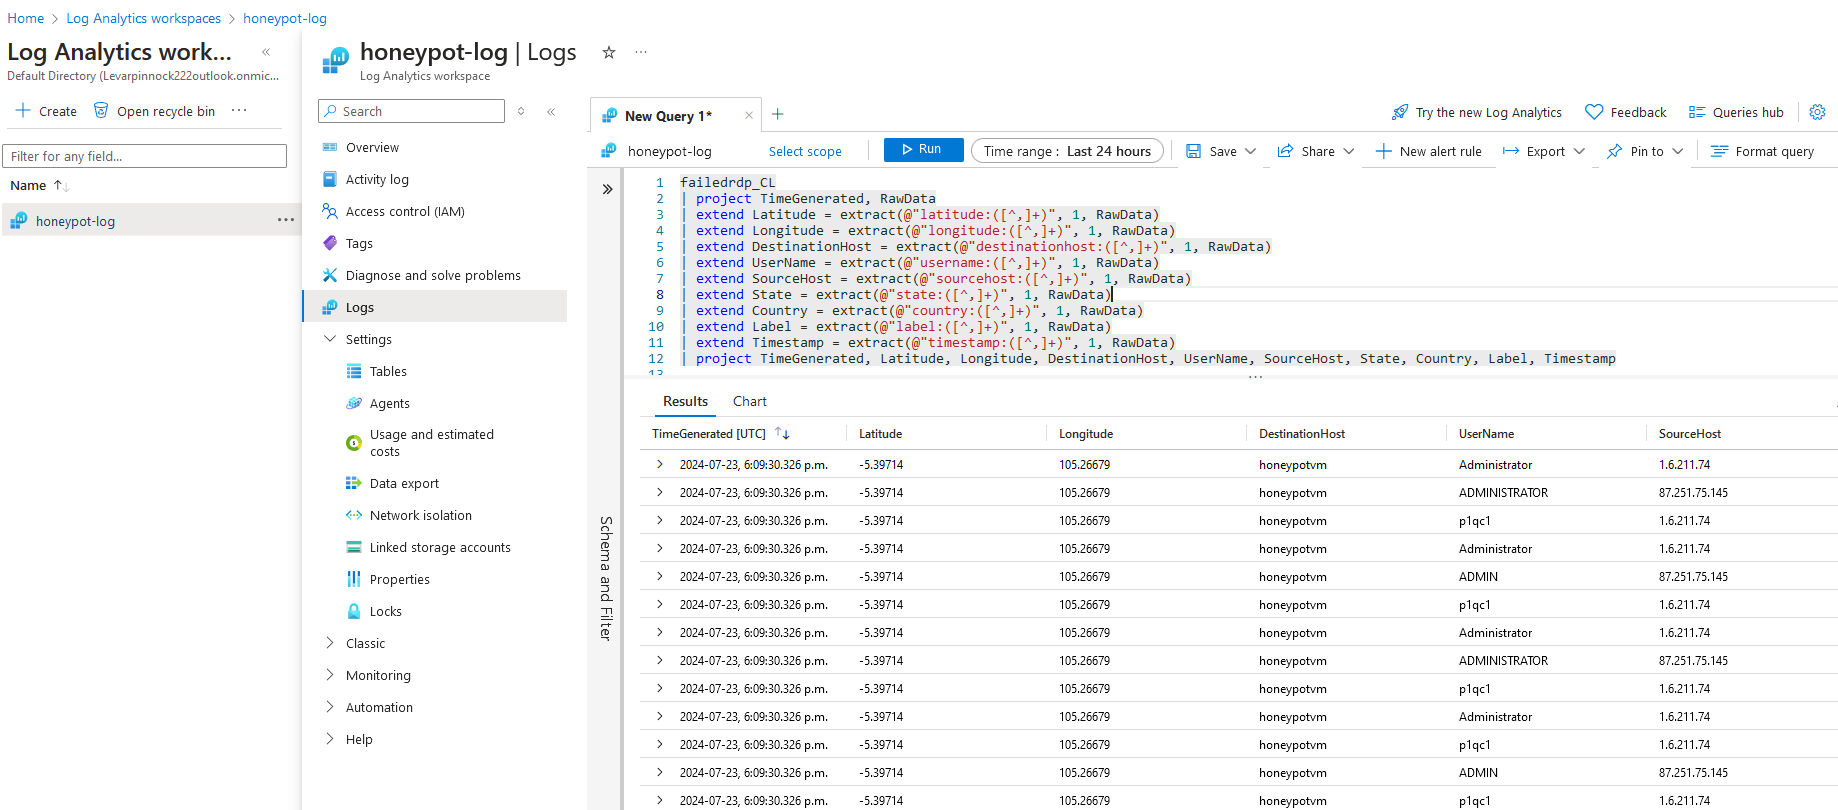
change the name here to the name of your output file. The raw data should now be organized like it is in the screenshot
Step 9 - Setting up the Map in Microsoft Sentinel
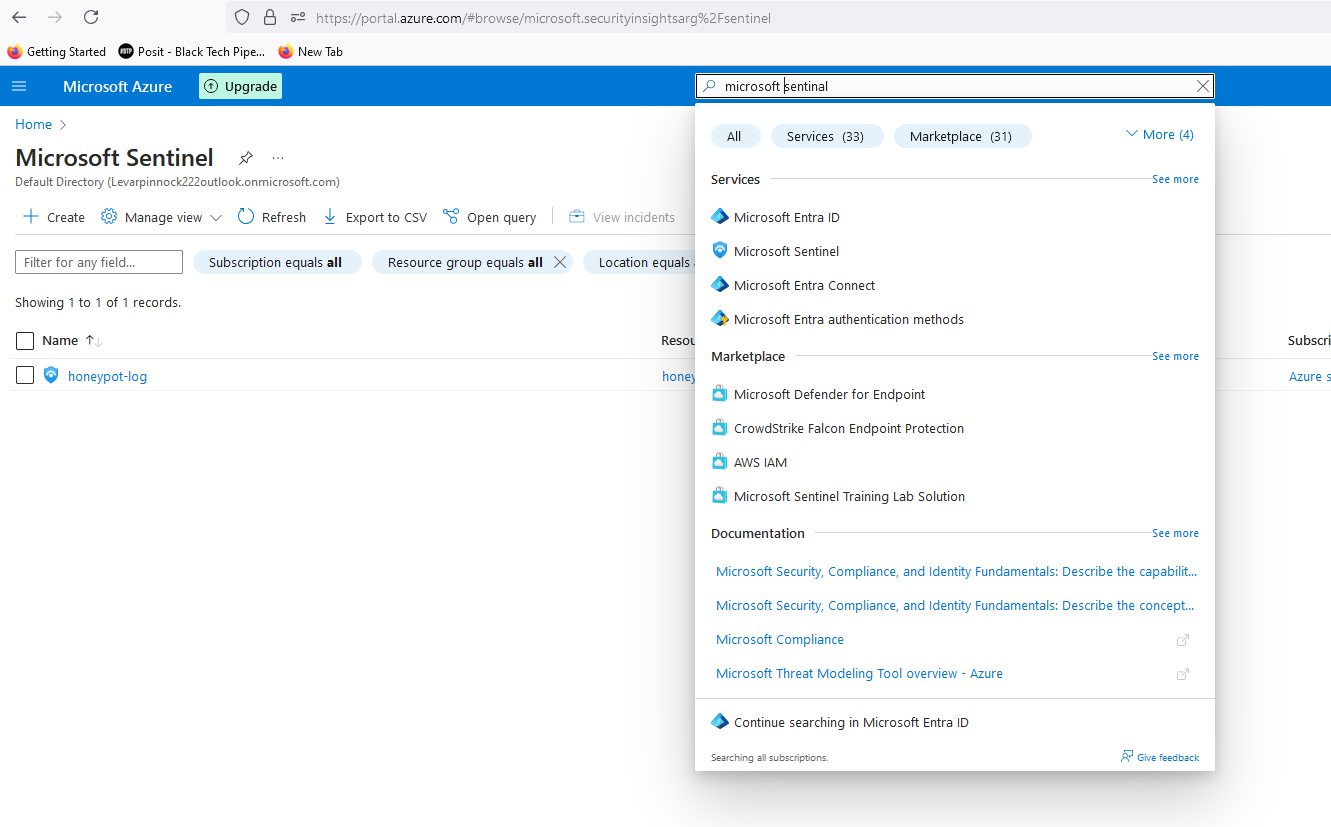
9a. from the main screen on Azure, search for "Microsoft Sentinel", and select your honeypot logs
9b. From the overview page, under "Threat Management" click on "Workbooks". Then click, "+Add Workbook"
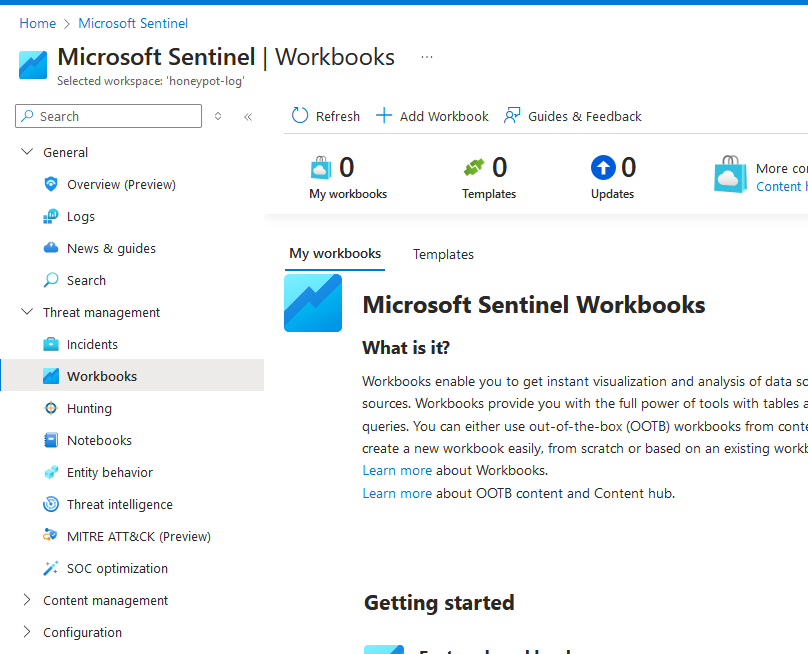
9c. Click "Edit" then delete what's already there
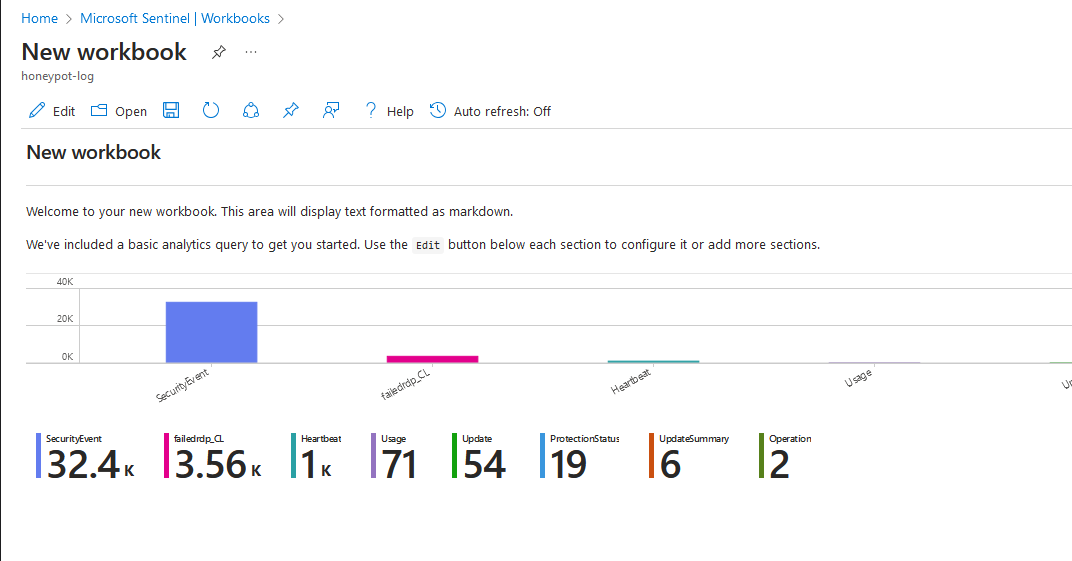


9d. Click Add, then "Add Query", then copy and paste the code below, then hit "Run query"
    failedrdp_CL
| project TimeGenerated, RawData
| extend Latitude = extract(@"latitude:([^,]+)", 1, RawData)
| extend Longitude = extract(@"longitude:([^,]+)", 1, RawData)
| extend DestinationHost = extract(@"destinationhost:([^,]+)", 1, RawData)
| extend UserName = extract(@"username:([^,]+)", 1, RawData)
| extend SourceHost = extract(@"sourcehost:([^,]+)", 1, RawData)
| extend State = extract(@"state:([^,]+)", 1, RawData)
| extend Country = extract(@"country:([^,]+)", 1, RawData)
| extend Label = extract(@"label:([^,]+)", 1, RawData)
| extend Timestamp = extract(@"timestamp:([^,]+)", 1, RawData)
| project TimeGenerated, Latitude, Longitude, DestinationHost, UserName, SourceHost, State, Country, Label, Timestamp
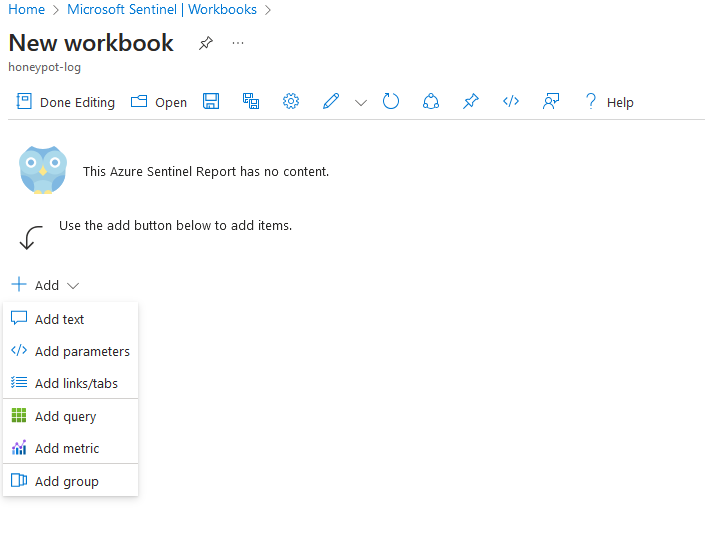
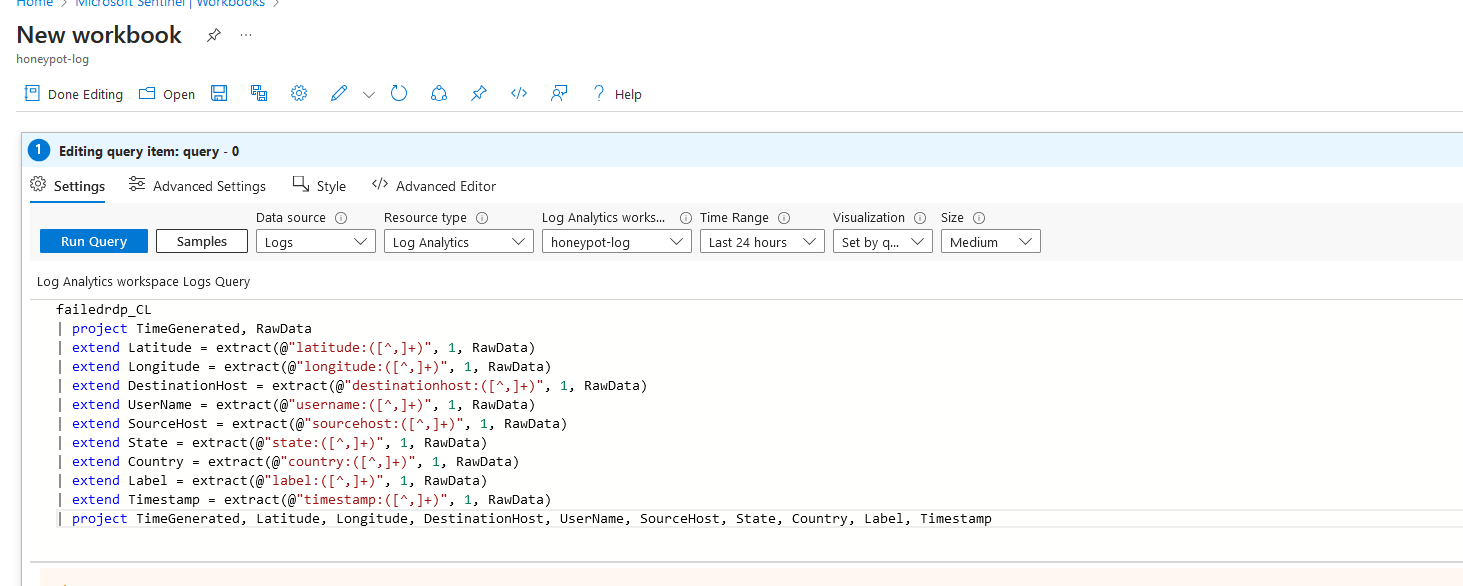
9e. Click on the Drop down menu for "Visualization" and Select " Map"
9f. ensure settings are similar to what you see in the screenshots, then click "apply", and "save and close"
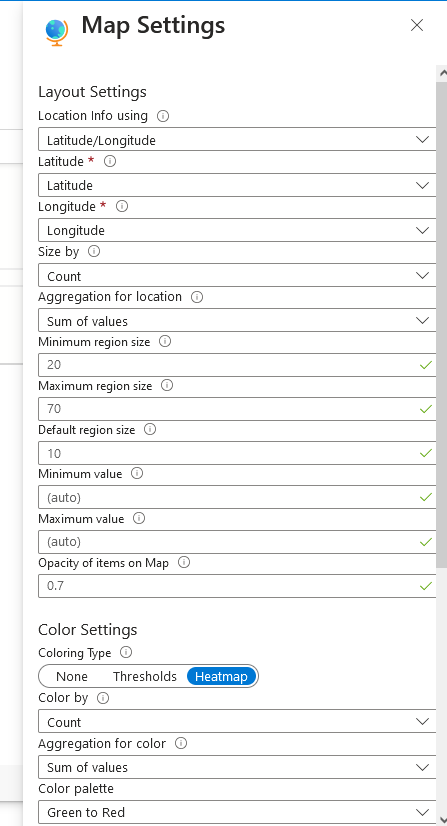
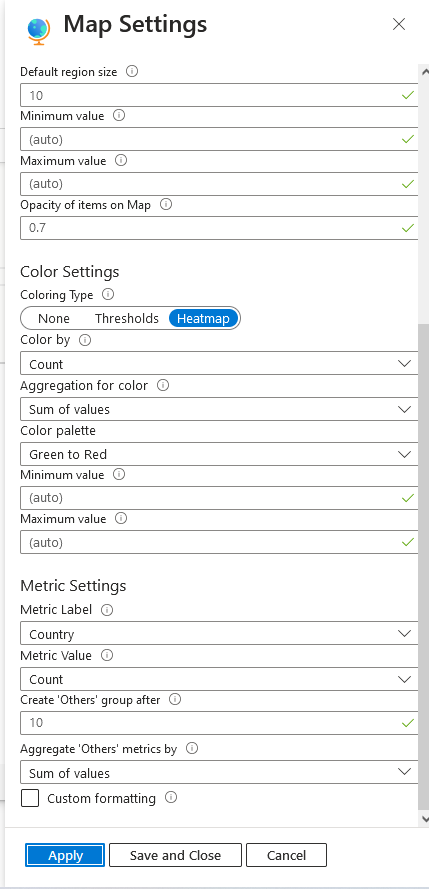
9g. now, as long as your script is running on the VM, you have successfully created and own a live heatmap of attack attempts
